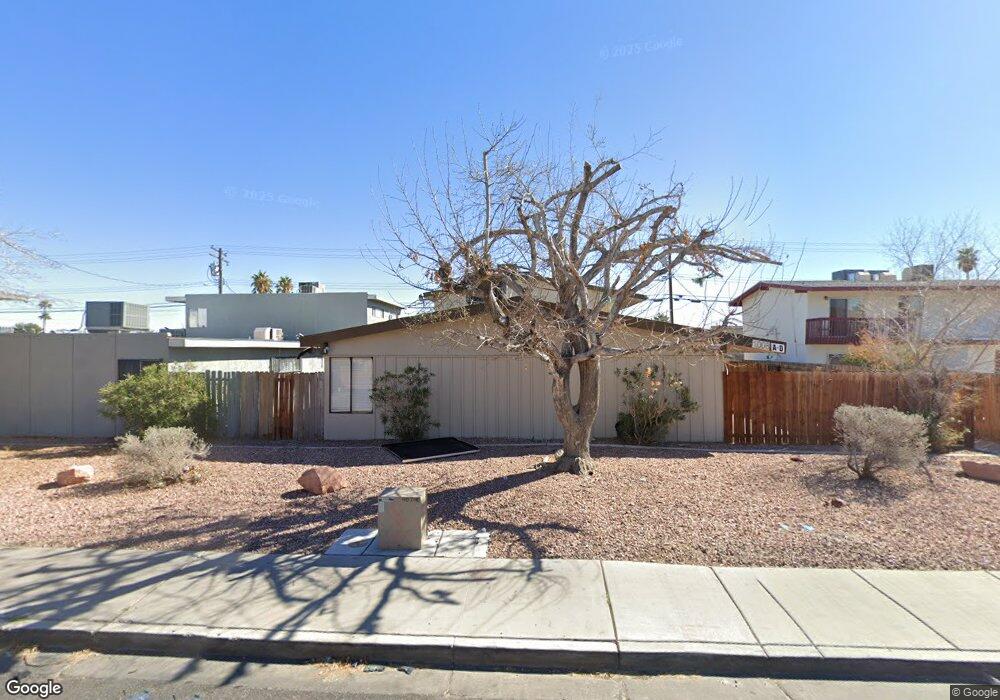
1008 N Jones Blvd Unit 39A Las Vegas, NV 89108
Michael Way NeighborhoodEstimated Value: $682,000 - $790,000
8
Beds
4
Baths
3,400
Sq Ft
$211/Sq Ft
Est. Value
About This Home
This home is located at 1008 N Jones Blvd Unit 39A, Las Vegas, NV 89108 and is currently estimated at $716,368, approximately $210 per square foot. 1008 N Jones Blvd Unit 39A is a home located in Clark County with nearby schools including Paul E. Culley Elementary School, Robert O Gibson Middle School, and Western High School.
Ownership History
Date
Name
Owned For
Owner Type
Purchase Details
Closed on
Apr 11, 2025
Sold by
Rivera Francisco and Jimenez Andrea Ahumada
Bought by
Rivera Property 2 Llc
Current Estimated Value
Purchase Details
Closed on
Jun 30, 2023
Sold by
Hernandez Morgan A Banos
Bought by
Rivera Francisco and Jimenez Andrea Ahumada
Home Financials for this Owner
Home Financials are based on the most recent Mortgage that was taken out on this home.
Original Mortgage
$387,300
Interest Rate
6.79%
Mortgage Type
New Conventional
Purchase Details
Closed on
Oct 20, 2022
Sold by
Ramirez Noralia Lopez
Bought by
Hernandez Morgan A Banos
Home Financials for this Owner
Home Financials are based on the most recent Mortgage that was taken out on this home.
Original Mortgage
$452,000
Interest Rate
6.7%
Mortgage Type
New Conventional
Purchase Details
Closed on
Aug 18, 2016
Sold by
Castellanos Tomas H
Bought by
Ramirez Noralia Lopez
Home Financials for this Owner
Home Financials are based on the most recent Mortgage that was taken out on this home.
Original Mortgage
$216,015
Interest Rate
3.37%
Mortgage Type
FHA
Purchase Details
Closed on
Aug 17, 2016
Sold by
Mena Jhon Ronal Vega
Bought by
Ramirez Noralia Lopez
Home Financials for this Owner
Home Financials are based on the most recent Mortgage that was taken out on this home.
Original Mortgage
$216,015
Interest Rate
3.37%
Mortgage Type
FHA
Purchase Details
Closed on
Aug 2, 2013
Sold by
Jones Apartments Llc
Bought by
Castellanos Tomas H
Home Financials for this Owner
Home Financials are based on the most recent Mortgage that was taken out on this home.
Original Mortgage
$156,120
Interest Rate
5.5%
Mortgage Type
FHA
Purchase Details
Closed on
Nov 8, 2011
Sold by
Desert Land Holdings Corporation
Bought by
Jones Apartments Llc
Purchase Details
Closed on
May 18, 2011
Sold by
Safai Fereydoon and Safai Mahnaz
Bought by
Desert Land Holdings Corp
Home Financials for this Owner
Home Financials are based on the most recent Mortgage that was taken out on this home.
Original Mortgage
$50,000
Interest Rate
4.01%
Mortgage Type
Unknown
Purchase Details
Closed on
Jun 3, 2005
Sold by
Aztec Realty Co
Bought by
Safai Fereydoon and Safai Mahnaz
Home Financials for this Owner
Home Financials are based on the most recent Mortgage that was taken out on this home.
Original Mortgage
$320,000
Interest Rate
6.87%
Mortgage Type
Fannie Mae Freddie Mac
Create a Home Valuation Report for This Property
The Home Valuation Report is an in-depth analysis detailing your home's value as well as a comparison with similar homes in the area
Home Values in the Area
Average Home Value in this Area
Purchase History
| Date | Buyer | Sale Price | Title Company |
|---|---|---|---|
| Rivera Property 2 Llc | -- | None Listed On Document | |
| Rivera Francisco | $645,500 | Netco Title | |
| Hernandez Morgan A Banos | $565,000 | Netco Title | |
| Ramirez Noralia Lopez | $220,000 | Lawyers Title Of Nevada | |
| Ramirez Noralia Lopez | -- | Lawyers Title Of Nevada | |
| Castellanos Tomas H | $159,000 | Chicago Title Of Nevada | |
| Jones Apartments Llc | -- | None Available | |
| Desert Land Holdings Corp | $100,000 | Lawyers Title Of Nevada Hen | |
| Safai Fereydoon | $434,900 | Land Title Of Nevada |
Source: Public Records
Mortgage History
| Date | Status | Borrower | Loan Amount |
|---|---|---|---|
| Previous Owner | Rivera Francisco | $387,300 | |
| Previous Owner | Hernandez Morgan A Banos | $452,000 | |
| Previous Owner | Ramirez Noralia Lopez | $216,015 | |
| Previous Owner | Ramirez Noralia Lopez | $216,015 | |
| Previous Owner | Castellanos Tomas H | $156,120 | |
| Previous Owner | Desert Land Holdings Corp | $50,000 | |
| Previous Owner | Safai Fereydoon | $320,000 | |
| Closed | Safai Fereydoon | $40,000 |
Source: Public Records
Tax History Compared to Growth
Tax History
| Year | Tax Paid | Tax Assessment Tax Assessment Total Assessment is a certain percentage of the fair market value that is determined by local assessors to be the total taxable value of land and additions on the property. | Land | Improvement |
|---|---|---|---|---|
| 2025 | $1,771 | $87,837 | $55,300 | $32,537 |
| 2024 | $1,641 | $87,837 | $55,300 | $32,537 |
| 2023 | $1,641 | $73,261 | $44,800 | $28,461 |
| 2022 | $2,854 | $64,265 | $37,800 | $26,465 |
| 2021 | $1,407 | $49,446 | $24,850 | $24,596 |
| 2020 | $1,304 | $48,996 | $24,850 | $24,146 |
| 2019 | $1,222 | $46,546 | $23,100 | $23,446 |
| 2018 | $1,166 | $45,264 | $23,100 | $22,164 |
| 2017 | $1,304 | $39,778 | $18,025 | $21,753 |
| 2016 | $1,092 | $36,750 | $15,400 | $21,350 |
| 2015 | $1,089 | $34,593 | $14,000 | $20,593 |
| 2014 | $1,055 | $31,235 | $11,200 | $20,035 |
Source: Public Records
Map
Nearby Homes
- 1116 N Jones Blvd
- 5924 Iris Ave
- 5816 Marka Dr
- 704 N Wallace Dr
- 912 Saylor Way
- 1120 Saylor Way
- 6205 Carmen Blvd
- 1200 Saylor Way
- 6224 Fargo Ave
- 6229 Saginaw Dr
- 6100 Fawn Cir
- 1336 N Jones Blvd
- 1105 Winwood St
- 5720 Goldmount Ave
- 6121 Fawn Cir
- 5709 Goldmount Ave
- 6299 W Washington Ave
- 6244 Rassler Ave
- 6112 Denver Cir
- 5612 Pearldrop Ave
- 1008 N Jones Blvd
- 1004 N Jones Blvd Unit 39A
- 1004 N Jones Blvd Unit A
- 1004 N Jones Blvd Unit B
- 1004 N Jones Blvd Unit D
- 1004 N Jones Blvd Unit c
- 1004 N Jones Blvd
- 1012 N Jones Blvd
- 1000 N Jones Blvd Unit 39A
- 1000 N Jones Blvd
- 1000 N Jones Blvd Unit A-D
- 1016 N Jones Blvd
- 1013 N Mallard St
- 1017 N Mallard St
- 1009 N Mallard St
- 1021 N Mallard St
- 916 N Jones Blvd Unit 39A
- 916 N Jones Blvd
- 1005 N Mallard St
- 1100 N Jones Blvd Unit B