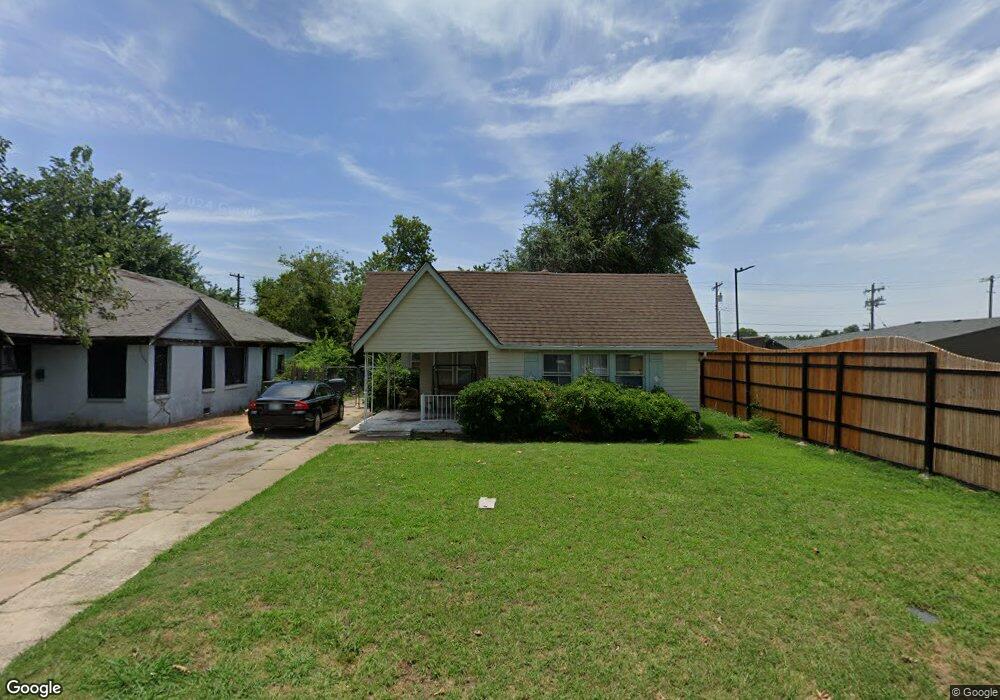
1008 NW 90th St Oklahoma City, OK 73114
Britton NeighborhoodEstimated Value: $112,088 - $156,000
2
Beds
1
Bath
1,088
Sq Ft
$117/Sq Ft
Est. Value
About This Home
This home is located at 1008 NW 90th St, Oklahoma City, OK 73114 and is currently estimated at $127,522, approximately $117 per square foot. 1008 NW 90th St is a home located in Oklahoma County with nearby schools including Nichols Hills Enterprise Elementary School, John Marshall Enterprise Middle School, and John Marshall Enterprise High School.
Ownership History
Date
Name
Owned For
Owner Type
Purchase Details
Closed on
Jul 31, 2007
Sold by
Findahl Charles C
Bought by
Tillman Leighann
Current Estimated Value
Home Financials for this Owner
Home Financials are based on the most recent Mortgage that was taken out on this home.
Original Mortgage
$65,472
Outstanding Balance
$41,411
Interest Rate
6.64%
Mortgage Type
Purchase Money Mortgage
Estimated Equity
$86,111
Purchase Details
Closed on
Jun 30, 2005
Sold by
Witten Danny L and Witten Susan C
Bought by
Findahl Charles C
Home Financials for this Owner
Home Financials are based on the most recent Mortgage that was taken out on this home.
Original Mortgage
$38,087
Interest Rate
5.64%
Mortgage Type
FHA
Purchase Details
Closed on
Dec 24, 2003
Sold by
Witten Susan C and Witten Ellene Busby
Bought by
Witten Danny L and Witten Susan C
Create a Home Valuation Report for This Property
The Home Valuation Report is an in-depth analysis detailing your home's value as well as a comparison with similar homes in the area
Home Values in the Area
Average Home Value in this Area
Purchase History
| Date | Buyer | Sale Price | Title Company |
|---|---|---|---|
| Tillman Leighann | $66,500 | Stewart Abstract & Title Of | |
| Findahl Charles C | $38,000 | Oklahoma City Abstract & Tit | |
| Witten Danny L | -- | -- |
Source: Public Records
Mortgage History
| Date | Status | Borrower | Loan Amount |
|---|---|---|---|
| Open | Tillman Leighann | $65,472 | |
| Previous Owner | Findahl Charles C | $38,087 |
Source: Public Records
Tax History Compared to Growth
Tax History
| Year | Tax Paid | Tax Assessment Tax Assessment Total Assessment is a certain percentage of the fair market value that is determined by local assessors to be the total taxable value of land and additions on the property. | Land | Improvement |
|---|---|---|---|---|
| 2024 | $561 | $5,737 | $1,142 | $4,595 |
| 2023 | $561 | $5,569 | $1,097 | $4,472 |
| 2022 | $518 | $5,406 | $679 | $4,727 |
| 2021 | $500 | $5,249 | $797 | $4,452 |
| 2020 | $488 | $5,097 | $916 | $4,181 |
| 2019 | $470 | $4,949 | $889 | $4,060 |
| 2018 | $432 | $4,805 | $0 | $0 |
| 2017 | $415 | $4,665 | $825 | $3,840 |
| 2016 | $400 | $4,529 | $818 | $3,711 |
| 2015 | $389 | $4,397 | $922 | $3,475 |
| 2014 | $372 | $4,269 | $880 | $3,389 |
Source: Public Records
Map
Nearby Homes
- 900 NW 89th St
- 904 NW 88th St
- 913 NW 87th St
- 1161 NW 89th St
- 1156 NW 91st St
- 737 NW 89th St
- 705 NW 89th St
- 1225 NW 91st St
- 729 NW 86th St
- 615 NW 90th St
- 1007 NW 95th St
- 1100 Kenilworth Rd
- 1416 NW 92nd St
- 9517 N University Ave
- 1219 Westchester Dr
- 1440 NW 90th St
- 1229 NW 83rd St
- 606 NW 95th St
- 428 NW 91st St
- 1434 NW 92nd St
- 1004 NW 90th St
- 1000 NW 90th St
- 9013 N Olie Ave
- 9007 N Olie Ave
- 1011 NW 89th St
- 1001 NW 89th St
- 1009 NW 90th St
- 920 NW 90th St
- 1013 NW 90th St
- 1001 NW 90th St
- 1017 NW 90th St
- 916 NW 90th St
- 921 NW 89th St
- 912 NW 90th St
- 9001 N Western Ave
- 913 NW 89th St
- 908 NW 90th St
- 1006 NW 89th St
- 1008 NW 91st St
- 1012 NW 91st St