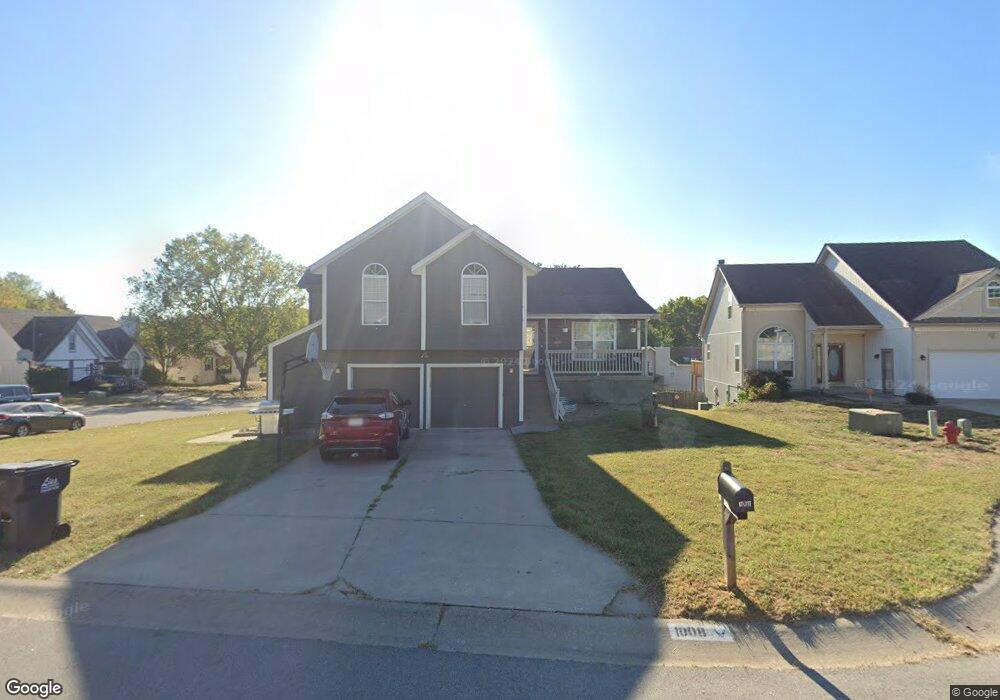
1008 NW Creek Side Cir Blue Springs, MO 64015
Estimated Value: $315,015 - $342,000
4
Beds
4
Baths
1,537
Sq Ft
$212/Sq Ft
Est. Value
About This Home
This home is located at 1008 NW Creek Side Cir, Blue Springs, MO 64015 and is currently estimated at $326,504, approximately $212 per square foot. 1008 NW Creek Side Cir is a home located in Jackson County with nearby schools including John Nowlin Elementary School, Paul Kinder Middle School, and Blue Springs High School.
Ownership History
Date
Name
Owned For
Owner Type
Purchase Details
Closed on
Aug 14, 2009
Sold by
Reeves Mark A and Reeves Catherine A
Bought by
Romero Fredy and Romero Enedina
Current Estimated Value
Purchase Details
Closed on
Jul 6, 2000
Sold by
Federal National Mortgage Association
Bought by
Reeves Mark A and Reeves Catherine A
Home Financials for this Owner
Home Financials are based on the most recent Mortgage that was taken out on this home.
Original Mortgage
$107,000
Interest Rate
8.66%
Mortgage Type
Purchase Money Mortgage
Purchase Details
Closed on
Mar 8, 2000
Sold by
Wheeler Patricia D and Wheeler Kenneth G
Bought by
Bank Of Oklahoma Na and Bok Mtg
Purchase Details
Closed on
Apr 10, 1996
Sold by
Mike Bromley Constr Inc
Bought by
Wheeler Kenneth G and Wheeler Patricia D
Home Financials for this Owner
Home Financials are based on the most recent Mortgage that was taken out on this home.
Original Mortgage
$104,500
Interest Rate
7.42%
Mortgage Type
Purchase Money Mortgage
Create a Home Valuation Report for This Property
The Home Valuation Report is an in-depth analysis detailing your home's value as well as a comparison with similar homes in the area
Home Values in the Area
Average Home Value in this Area
Purchase History
| Date | Buyer | Sale Price | Title Company |
|---|---|---|---|
| Romero Fredy | -- | Chicago | |
| Reeves Mark A | -- | Old Republic Title Company | |
| Federal National Mortgage Association | -- | -- | |
| Bank Of Oklahoma Na | $100,000 | First American Title Ins | |
| Wheeler Kenneth G | -- | -- |
Source: Public Records
Mortgage History
| Date | Status | Borrower | Loan Amount |
|---|---|---|---|
| Previous Owner | Reeves Mark A | $107,000 | |
| Previous Owner | Wheeler Kenneth G | $104,500 |
Source: Public Records
Tax History Compared to Growth
Tax History
| Year | Tax Paid | Tax Assessment Tax Assessment Total Assessment is a certain percentage of the fair market value that is determined by local assessors to be the total taxable value of land and additions on the property. | Land | Improvement |
|---|---|---|---|---|
| 2025 | $4,643 | $50,757 | $6,715 | $44,042 |
| 2024 | $4,554 | $56,915 | $7,138 | $49,777 |
| 2023 | $4,554 | $56,915 | $6,601 | $50,314 |
| 2022 | $3,475 | $38,380 | $5,833 | $32,547 |
| 2021 | $3,472 | $38,380 | $5,833 | $32,547 |
| 2020 | $3,103 | $34,893 | $5,833 | $29,060 |
| 2019 | $3,000 | $34,893 | $5,833 | $29,060 |
| 2018 | $2,695 | $30,171 | $3,561 | $26,610 |
| 2017 | $2,644 | $30,171 | $3,561 | $26,610 |
| 2016 | $2,644 | $29,678 | $3,838 | $25,840 |
| 2014 | $2,542 | $28,442 | $3,591 | $24,851 |
Source: Public Records
Map
Nearby Homes
- 4508 NW Valley View Rd
- 4301 NW Briarwood Dr
- 0 No Address Assigned By County N A Unit HMS2492165
- 1401 NW Birdseye Ct
- 5200 NW Primrose Ct
- 5205 NW Primrose Ct
- 1204 NW 55th St
- 1515 NW Primrose Ln
- 4012 NW Delwood Ct
- 14 Emerald Shore Dr
- 405 Bellemere Rd
- 704 NW 39th St
- 404 Countryside Rd
- 403 Countryside Rd
- 4075 SW M 7 Hwy
- 3605 NW Dogwood Dr
- 3616 NW Dogwood Dr
- 20912 E 50th Street Ct S
- 27 Beach Dr
- 3213 NW Canterbury Place
- 1000 NW Creek Side Cir
- 4713 NW Creek Side Ln
- 4709 NW Creek Side Ln
- 4717 NW Creek Side Ln
- 1009 NW Creek Side Cir
- 4701 NW Pennington Ln
- 1005 NW Creek Side Cir
- 1001 NW Creek Side Cir
- 4705 NW Creek Side Ln
- 4705 NW Pennington Ln
- 4701 NW Creek Side Ln
- 4720 NW Creek Side Ln
- 4717 NW Pennington Ln
- 4724 NW Creek Side Ln
- 4721 NW Pennington Ln
- 4700 NW Pennington Ln
- 4704 NW Pennington Ln
- 4624 NW Pennington Ln
- 4721 NW Creek Side Ln
- 4801 NW Pennington Ln