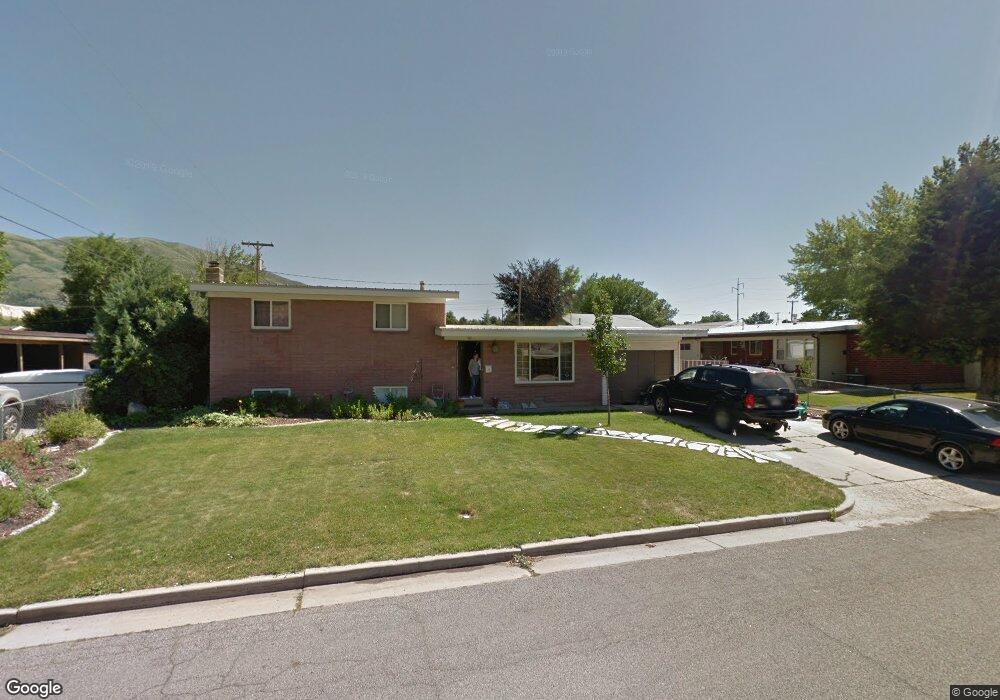
1008 Orchard Dr Brigham City, UT 84302
Estimated Value: $359,000 - $380,000
3
Beds
1
Bath
1,103
Sq Ft
$334/Sq Ft
Est. Value
About This Home
This home is located at 1008 Orchard Dr, Brigham City, UT 84302 and is currently estimated at $368,542, approximately $334 per square foot. 1008 Orchard Dr is a home located in Box Elder County with nearby schools including Box Elder Middle School, Adele C. Young Intermediate School, and Box Elder High School.
Ownership History
Date
Name
Owned For
Owner Type
Purchase Details
Closed on
Mar 22, 2022
Sold by
Hadfield Michael J and Hadfield Renae R
Bought by
Hadfield Michael and Hadfield Renae
Current Estimated Value
Home Financials for this Owner
Home Financials are based on the most recent Mortgage that was taken out on this home.
Original Mortgage
$160,000
Outstanding Balance
$139,210
Interest Rate
3.39%
Mortgage Type
New Conventional
Estimated Equity
$229,332
Purchase Details
Closed on
Jul 8, 2005
Sold by
Secretary Of Housing And Urban Developme
Bought by
Hadfidld Michael J and Hadfidld Renae R
Home Financials for this Owner
Home Financials are based on the most recent Mortgage that was taken out on this home.
Original Mortgage
$86,275
Interest Rate
5.51%
Mortgage Type
FHA
Purchase Details
Closed on
Mar 11, 2005
Sold by
Mortgage Electronic Regist
Bought by
Secretary Of Hud
Purchase Details
Closed on
Feb 18, 2005
Sold by
Lundberg Scott
Bought by
Citimortgage Icn
Create a Home Valuation Report for This Property
The Home Valuation Report is an in-depth analysis detailing your home's value as well as a comparison with similar homes in the area
Home Values in the Area
Average Home Value in this Area
Purchase History
| Date | Buyer | Sale Price | Title Company |
|---|---|---|---|
| Hadfield Michael | -- | Northern Title Company | |
| Hadfidld Michael J | -- | None Available | |
| Secretary Of Hud | -- | None Available | |
| Citimortgage Icn | $121,324 | None Available |
Source: Public Records
Mortgage History
| Date | Status | Borrower | Loan Amount |
|---|---|---|---|
| Open | Hadfield Michael | $160,000 | |
| Previous Owner | Hadfidld Michael J | $86,275 |
Source: Public Records
Tax History Compared to Growth
Tax History
| Year | Tax Paid | Tax Assessment Tax Assessment Total Assessment is a certain percentage of the fair market value that is determined by local assessors to be the total taxable value of land and additions on the property. | Land | Improvement |
|---|---|---|---|---|
| 2025 | $1,697 | $332,582 | $105,000 | $227,582 |
| 2024 | $1,697 | $324,565 | $100,000 | $224,565 |
| 2023 | $1,745 | $341,937 | $95,000 | $246,937 |
| 2022 | $1,555 | $155,758 | $22,000 | $133,758 |
| 2021 | $1,193 | $180,992 | $40,000 | $140,992 |
| 2020 | $1,123 | $180,992 | $40,000 | $140,992 |
| 2019 | $1,057 | $90,625 | $22,000 | $68,625 |
| 2018 | $950 | $81,673 | $22,000 | $59,673 |
| 2017 | $891 | $131,237 | $16,500 | $101,237 |
| 2016 | $932 | $69,529 | $16,500 | $53,029 |
| 2015 | $869 | $64,708 | $16,500 | $48,208 |
| 2014 | $869 | $62,412 | $16,500 | $45,912 |
| 2013 | -- | $62,412 | $16,500 | $45,912 |
Source: Public Records
Map
Nearby Homes
- 510 Aspen Dr
- 504 Aspen Dr
- 1076 E Sycamore Dr
- 1023 E 200 N
- 185 N 900 E
- 192 N Highland Blvd
- 1066 Beecher Ave
- 1228 Sheri Cir
- 535 N 300 E
- 150 N Marie Dr Unit 42
- 437 E 100 N
- 420 N 200 E
- 801 Medoland Dr
- 621 N 300 E
- 277 N 200 E
- 326 E 100 N
- 64 N Bywater Way
- 410 N Main St Unit 30
- 410 N Main St Unit 15
- 613 N 100 E
- 1018 Orchard Dr
- 354 Hawthorne St
- 1009 Oak Dr
- 1019 Oak Dr
- 342 Hawthorne St
- 1026 Orchard Dr
- 1009 Orchard Dr
- 1027 Oak Dr
- 1019 Orchard Dr
- 408 Hawthorne St
- 351 Hawthorne Dr
- 1036 Orchard Dr
- 361 Hawthorne St
- 1029 Orchard Dr
- 1029 Orchard Dr
- 371 Hawthorne St
- 351 Hawthorne St
- 1037 Oak Dr
- 1041 Orchard Dr
- 405 Hawthorne St