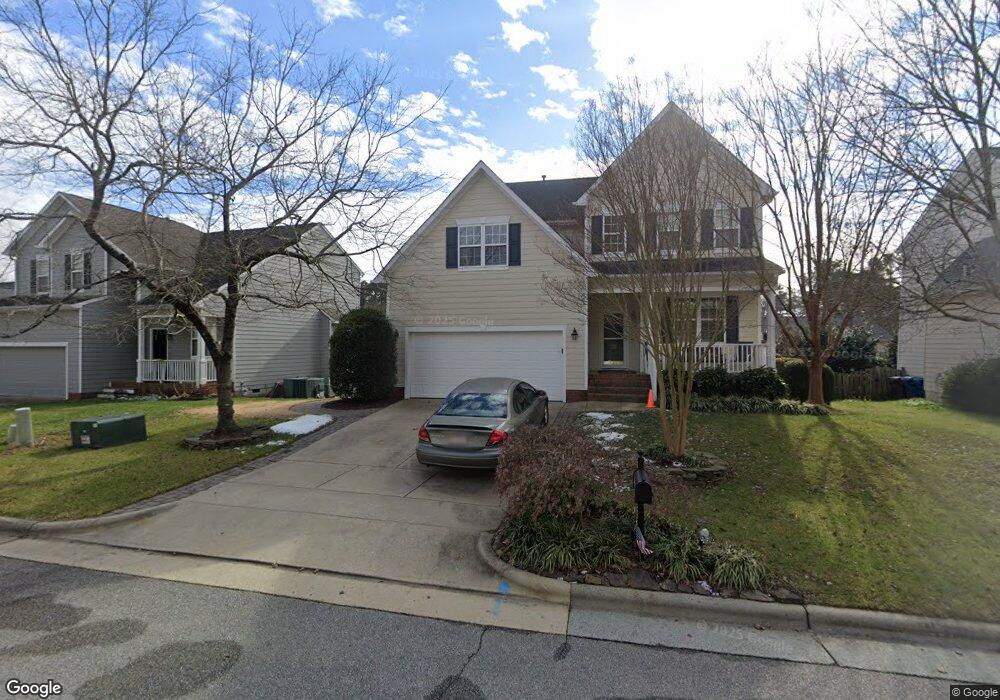
1008 Professor Place Durham, NC 27713
South Durham NeighborhoodEstimated Value: $553,000 - $578,000
3
Beds
3
Baths
2,235
Sq Ft
$252/Sq Ft
Est. Value
About This Home
This home is located at 1008 Professor Place, Durham, NC 27713 and is currently estimated at $563,051, approximately $251 per square foot. 1008 Professor Place is a home located in Durham County with nearby schools including Lowe's Grove Middle, Hillside High School, and AL Huda Academy.
Ownership History
Date
Name
Owned For
Owner Type
Purchase Details
Closed on
May 8, 2013
Sold by
Brehmer Charles F and Brehmer Angela J
Bought by
Stoffel Thomas J and Stoffel Regina A
Current Estimated Value
Purchase Details
Closed on
Jun 15, 2006
Sold by
Lavender Mark D and Dornbrook Lavender Kimberly
Bought by
Brehmer Charles F and Brehmer Angela J
Home Financials for this Owner
Home Financials are based on the most recent Mortgage that was taken out on this home.
Original Mortgage
$265,000
Interest Rate
6.51%
Mortgage Type
Fannie Mae Freddie Mac
Purchase Details
Closed on
Feb 5, 2002
Sold by
Don Galloway Homes Llc
Bought by
Lavender Mark D and Dornbrook Lavender Kimberly
Home Financials for this Owner
Home Financials are based on the most recent Mortgage that was taken out on this home.
Original Mortgage
$157,048
Interest Rate
6.25%
Create a Home Valuation Report for This Property
The Home Valuation Report is an in-depth analysis detailing your home's value as well as a comparison with similar homes in the area
Home Values in the Area
Average Home Value in this Area
Purchase History
We collect this data history from publicly available records. To have your information removed, we recommend requesting removal directly through your county’s website.
| Date | Buyer | Sale Price | Title Company |
|---|---|---|---|
| Stoffel Thomas J | $220,000 | None Available | |
| Brehmer Charles F | $265,000 | None Available | |
| Lavender Mark D | $196,500 | -- |
Source: Public Records
Mortgage History
We collect this data history from publicly available records. To have your information removed, we recommend requesting removal directly through your county’s website.
| Date | Status | Borrower | Loan Amount |
|---|---|---|---|
| Previous Owner | Brehmer Charles F | $265,000 | |
| Previous Owner | Lavender Mark D | $157,048 |
Source: Public Records
Tax History
| Year | Tax Paid | Tax Assessment Tax Assessment Total Assessment is a certain percentage of the fair market value that is determined by local assessors to be the total taxable value of land and additions on the property. | Land | Improvement |
|---|---|---|---|---|
| 2025 | $5,567 | $561,595 | $165,300 | $396,295 |
| 2024 | $4,441 | $318,343 | $72,437 | $245,906 |
| 2023 | $4,170 | $318,343 | $72,437 | $245,906 |
| 2022 | $4,074 | $318,343 | $72,437 | $245,906 |
| 2021 | $4,055 | $318,343 | $72,437 | $245,906 |
| 2020 | $3,960 | $318,343 | $72,437 | $245,906 |
| 2019 | $3,960 | $318,343 | $72,437 | $245,906 |
| 2018 | $3,551 | $261,810 | $49,257 | $212,553 |
| 2017 | $3,525 | $261,810 | $49,257 | $212,553 |
| 2016 | $3,564 | $273,886 | $49,257 | $224,629 |
| 2015 | $3,404 | $245,904 | $48,473 | $197,431 |
| 2014 | $3,673 | $265,306 | $48,473 | $216,833 |
Source: Public Records
Map
Nearby Homes
- 1004 Chancellors Ridge Dr
- 115 Baccalaureate Blvd
- 105 Strangford Ln
- 1304 Professor Place
- 1203 Chancellors Ridge Dr
- 1104 Scholastic Cir
- 1201 Antler Point Dr
- 7 Bobcat Ct
- 112 College Ave
- 102 College Ave
- 107 Chancellors Ridge Dr
- 1312 Southpoint Trail
- 120 Student Place
- 1136 Southpoint Trail
- 933 S Bend Dr
- 200 Swift Creek Crossing
- 1026 Bradburn Dr
- 8202 N Carolina 751
- 961 Daybreak Dr
- 605 Swift Creek Crossing
- 1010 Professor Place
- 1006 Professor Place
- 1005 Chancellors Ridge Dr
- 1004 Professor Place
- 1102 Professor Place
- 1003 Chancellors Ridge Dr
- 308 Senior Ave
- 1007 Professor Place
- 1007 Chancellors Ridge Dr
- 1005 Professor Place
- 1104 Professor Place
- 309 Senior Ave
- 306 Senior Ave
- 203 Baccalaureate Blvd
- 1003 Professor Place
- 201 Baccalaureate Blvd
- 205 Baccalaureate Blvd
- 307 Senior Ave
- 1106 Professor Place
- 304 Senior Ave
Your Personal Tour Guide
Ask me questions while you tour the home.