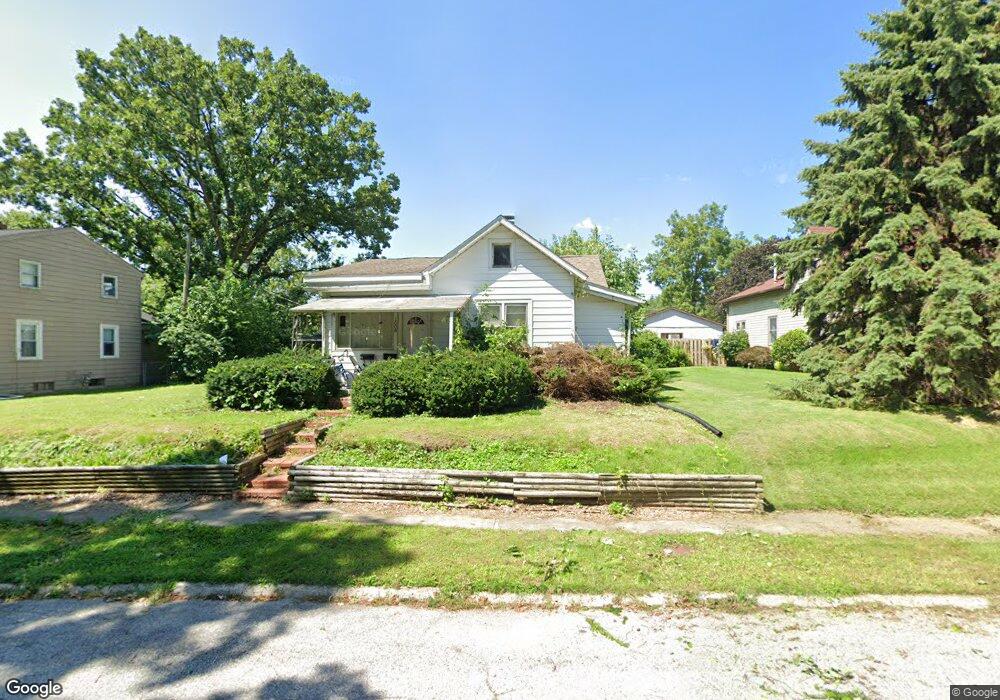
1008 S 21st St Lafayette, IN 47905
South Oakland NeighborhoodEstimated Value: $237,000
--
Bed
2
Baths
2,112
Sq Ft
$112/Sq Ft
Est. Value
About This Home
This home is located at 1008 S 21st St, Lafayette, IN 47905 and is currently estimated at $237,000, approximately $112 per square foot. 1008 S 21st St is a home with nearby schools including Oakland Elementary School, Lafayette Tecumseh Junior High School, and Sunnyside Intermediate School.
Ownership History
Date
Name
Owned For
Owner Type
Purchase Details
Closed on
Oct 9, 2014
Sold by
Glr Fund Llc
Bought by
Pilotinvestment Llc
Current Estimated Value
Home Financials for this Owner
Home Financials are based on the most recent Mortgage that was taken out on this home.
Original Mortgage
$83,050
Outstanding Balance
$27,900
Interest Rate
4.13%
Mortgage Type
New Conventional
Estimated Equity
$209,100
Purchase Details
Closed on
Apr 18, 2014
Sold by
Meek Phillip A and Wright Tod A
Bought by
Glr Fund Llc
Purchase Details
Closed on
Jul 21, 2004
Sold by
Roberts Scott
Bought by
Properties Of Central Indiana V
Create a Home Valuation Report for This Property
The Home Valuation Report is an in-depth analysis detailing your home's value as well as a comparison with similar homes in the area
Home Values in the Area
Average Home Value in this Area
Purchase History
| Date | Buyer | Sale Price | Title Company |
|---|---|---|---|
| Pilotinvestment Llc | -- | -- | |
| Glr Fund Llc | -- | -- | |
| Meek Philip A | -- | -- | |
| Properties Of Central Indiana V | -- | -- |
Source: Public Records
Mortgage History
| Date | Status | Borrower | Loan Amount |
|---|---|---|---|
| Open | Pilotinvestment Llc | $83,050 |
Source: Public Records
Tax History Compared to Growth
Tax History
| Year | Tax Paid | Tax Assessment Tax Assessment Total Assessment is a certain percentage of the fair market value that is determined by local assessors to be the total taxable value of land and additions on the property. | Land | Improvement |
|---|---|---|---|---|
| 2024 | $3,048 | $152,200 | $22,500 | $129,700 |
| 2023 | $1,580 | $78,900 | $22,500 | $56,400 |
| 2022 | $1,535 | $76,600 | $22,500 | $54,100 |
| 2021 | $1,507 | $75,100 | $22,500 | $52,600 |
| 2020 | $1,507 | $75,100 | $22,500 | $52,600 |
| 2019 | $1,509 | $75,100 | $16,000 | $59,100 |
| 2018 | $1,509 | $75,100 | $16,000 | $59,100 |
| 2017 | $1,471 | $73,100 | $16,000 | $57,100 |
| 2016 | $1,448 | $72,370 | $16,000 | $56,370 |
| 2014 | $1,368 | $68,400 | $16,000 | $52,400 |
| 2013 | $1,288 | $64,400 | $16,000 | $48,400 |
Source: Public Records
Map
Nearby Homes
- 2109 Central St
- 807 S 20th St
- 815 S 19th St
- 906 S 24th St
- 1309 S 23rd St
- 626 S 21st St
- 622 S 21st St
- 1501 Franklin St
- 1639 Stanforth Ave
- 1511 Kossuth St
- 2614 Main St
- 1920 Perdue St
- 1422 Virginia St
- 1226 Sinton Ave
- 1111 S 14th St
- 1501 El Prado Ave
- 1318 Sinton Ave
- 1406 Virginia St
- 1622 Perdue St
- 711 S 27th St