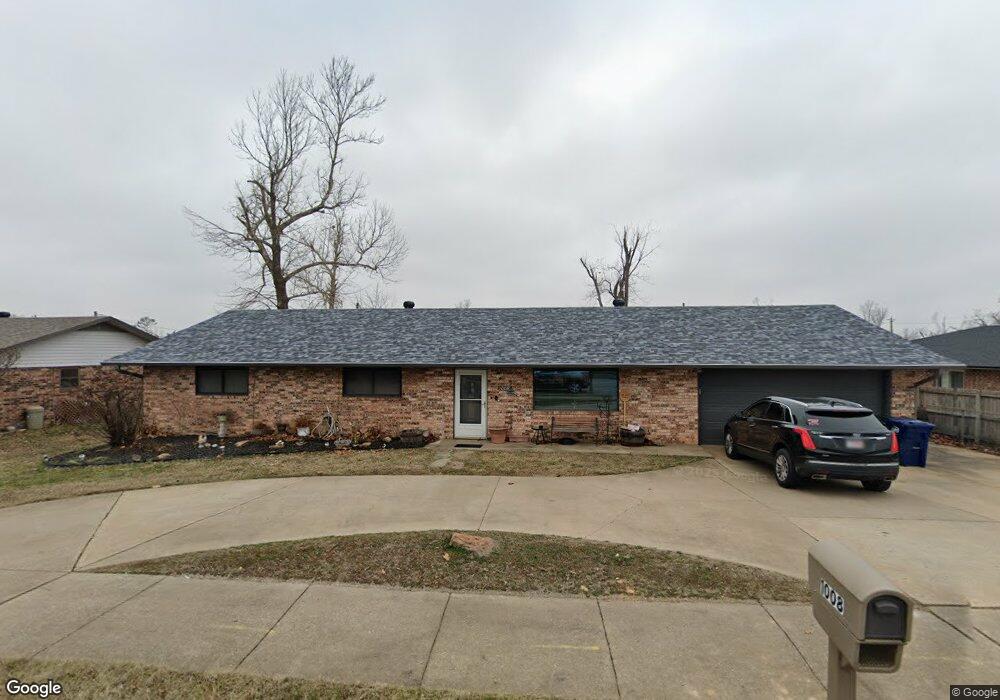
1008 S Dixieland Rd Rogers, AR 72758
Estimated Value: $346,000 - $387,000
3
Beds
2
Baths
1,988
Sq Ft
$183/Sq Ft
Est. Value
About This Home
This home is located at 1008 S Dixieland Rd, Rogers, AR 72758 and is currently estimated at $362,951, approximately $182 per square foot. 1008 S Dixieland Rd is a home located in Benton County with nearby schools including Westside Elementary School, Oakdale Middle School, and Rogers Heritage High School.
Ownership History
Date
Name
Owned For
Owner Type
Purchase Details
Closed on
Oct 24, 2019
Sold by
Simmons Georgia L and Simmons Richard G
Bought by
Simmons Georgia L
Current Estimated Value
Home Financials for this Owner
Home Financials are based on the most recent Mortgage that was taken out on this home.
Original Mortgage
$176,120
Outstanding Balance
$153,949
Interest Rate
3.5%
Mortgage Type
VA
Estimated Equity
$209,002
Purchase Details
Closed on
May 24, 2003
Bought by
Dod 05-24-2003
Purchase Details
Closed on
Apr 26, 1985
Bought by
Simmons
Purchase Details
Closed on
Jun 14, 1979
Bought by
Wall
Create a Home Valuation Report for This Property
The Home Valuation Report is an in-depth analysis detailing your home's value as well as a comparison with similar homes in the area
Home Values in the Area
Average Home Value in this Area
Purchase History
| Date | Buyer | Sale Price | Title Company |
|---|---|---|---|
| Simmons Georgia L | -- | New Title Company Name | |
| Dod 05-24-2003 | -- | -- | |
| Simmons | $55,000 | -- | |
| Wall | $45,000 | -- |
Source: Public Records
Mortgage History
| Date | Status | Borrower | Loan Amount |
|---|---|---|---|
| Open | Simmons Georgia L | $176,120 |
Source: Public Records
Tax History Compared to Growth
Tax History
| Year | Tax Paid | Tax Assessment Tax Assessment Total Assessment is a certain percentage of the fair market value that is determined by local assessors to be the total taxable value of land and additions on the property. | Land | Improvement |
|---|---|---|---|---|
| 2025 | $1,389 | $56,229 | $19,000 | $37,229 |
| 2024 | $1,355 | $56,229 | $19,000 | $37,229 |
| 2023 | $1,355 | $36,000 | $8,000 | $28,000 |
| 2022 | $1,034 | $36,000 | $8,000 | $28,000 |
| 2021 | $1,030 | $36,000 | $8,000 | $28,000 |
| 2020 | $1,031 | $25,610 | $4,600 | $21,010 |
| 2019 | $1,031 | $25,610 | $4,600 | $21,010 |
| 2018 | $1,056 | $25,610 | $4,600 | $21,010 |
| 2017 | $900 | $25,610 | $4,600 | $21,010 |
| 2016 | $900 | $25,610 | $4,600 | $21,010 |
| 2015 | $1,202 | $22,730 | $4,400 | $18,330 |
| 2014 | $852 | $22,730 | $4,400 | $18,330 |
Source: Public Records
Map
Nearby Homes
- 1012 S 19th St
- 1501 Countryside Cir
- 1905 W Countryside Ln
- 1903 Countryside Ln
- 910 S 16th St
- 902 S 17th St
- 917 S 15th St
- 2104 W Oak St
- 930 S 14th St
- 2001 & 2003 W Sycamore St
- 1611 S Beth Dr
- 2202 W Oak St
- 1701 Beth Dr
- 2308 W Willow St
- 1700 S 22nd St
- 1604 S 23rd St
- 825 S 23rd St
- 1704 S Dixieland Rd
- 1406 W Pine St
- 1312 S Countrywood Place
- 1006 S Dixieland Rd
- 1010 S Dixieland Rd
- 1830 W Dogwood St
- 1012 S Dixieland Rd
- 1207 S Dixieland Rd
- 1706 W Dogwood St
- 1617 W Ash St
- 924 S Dixieland Rd
- 1003 S 19th St
- 1001 S 19th St
- 1801 W Dogwood St
- 1016 S Dixieland Rd
- 1704 W Dogwood St
- 1005 S 19th St
- 1615 W Ash St
- 1616 W Ash St
- 922 S Dixieland Rd
- 923 S 19th St
- 1007 S 19th St
- 1020 S Dixieland Rd