Estimated Value: $572,000 - $594,000
3
Beds
3
Baths
2,161
Sq Ft
$268/Sq Ft
Est. Value
About This Home
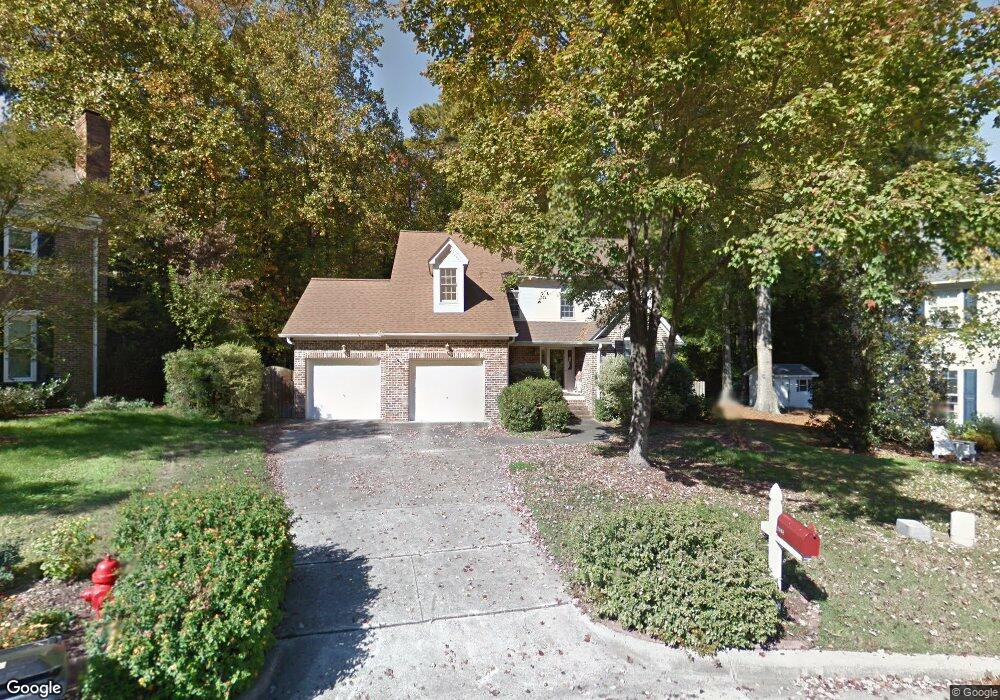
This home is located at 1008 Senoma Place, Apex, NC 27502 and is currently estimated at $579,177, approximately $268 per square foot. 1008 Senoma Place is a home located in Wake County with nearby schools including Apex Elementary School, Apex Middle, and Apex High School.
Ownership History
Date
Name
Owned For
Owner Type
Purchase Details
Closed on
Jun 8, 2023
Sold by
Inman Jeffrey Todd and Inman Melissa Stevenson
Bought by
Inman Living Trust
Current Estimated Value
Purchase Details
Closed on
Oct 15, 2014
Sold by
Halgren Judy Belle and Halgren Joan Louise
Bought by
Bonestell Joel D and Bonestell Stephanie Kay
Home Financials for this Owner
Home Financials are based on the most recent Mortgage that was taken out on this home.
Original Mortgage
$268,300
Interest Rate
3.75%
Mortgage Type
FHA
Purchase Details
Closed on
Dec 18, 2007
Sold by
Inman Jeffrey Todd and Inman Melissa
Bought by
Halgren Judy Belle and Halgren Joan Louise
Create a Home Valuation Report for This Property
The Home Valuation Report is an in-depth analysis detailing your home's value as well as a comparison with similar homes in the area
Home Values in the Area
Average Home Value in this Area
Purchase History
| Date | Buyer | Sale Price | Title Company |
|---|---|---|---|
| Inman Living Trust | -- | None Listed On Document | |
| Bonestell Joel D | $273,500 | None Available | |
| Halgren Judy Belle | $248,500 | None Available |
Source: Public Records
Mortgage History
| Date | Status | Borrower | Loan Amount |
|---|---|---|---|
| Previous Owner | Bonestell Joel D | $268,300 |
Source: Public Records
Tax History Compared to Growth
Tax History
| Year | Tax Paid | Tax Assessment Tax Assessment Total Assessment is a certain percentage of the fair market value that is determined by local assessors to be the total taxable value of land and additions on the property. | Land | Improvement |
|---|---|---|---|---|
| 2025 | $4,690 | $534,835 | $200,000 | $334,835 |
| 2024 | $4,585 | $534,835 | $200,000 | $334,835 |
| 2023 | $3,623 | $328,425 | $70,000 | $258,425 |
| 2022 | $3,401 | $328,425 | $70,000 | $258,425 |
| 2021 | $3,271 | $328,425 | $70,000 | $258,425 |
| 2020 | $3,239 | $328,425 | $70,000 | $258,425 |
| 2019 | $3,088 | $270,182 | $70,000 | $200,182 |
| 2018 | $2,909 | $270,182 | $70,000 | $200,182 |
| 2017 | $2,708 | $270,182 | $70,000 | $200,182 |
| 2016 | $2,669 | $270,182 | $70,000 | $200,182 |
| 2015 | $2,574 | $254,216 | $62,000 | $192,216 |
| 2014 | -- | $254,216 | $62,000 | $192,216 |
Source: Public Records
Map
Nearby Homes
- 4006 New Yarmouth Way
- 635 Sawcut Ln
- 631 Sawcut Ln
- 633 Sawcut Ln
- 295 Williams Grove Ln Unit Lot 67
- 285 Williams Grove Ln Unit Lot 65
- 214 Williams Grove Ln Unit Lot 4
- 218 Williams Grove Ln
- 226 Williams Grove Ln
- 262 Williams Grove Ln Unit Lot 76
- 278 Williams Grove Ln Unit Lot 73
- 286 Williams Grove Ln Unit Lot 71
- 294 Williams Grove Ln Unit 69
- 294 Williams Grove Ln
- 298 Williams Grove Ln N Unit 68
- 281 Williams Grove Ln Unit Lot 64
- 281 Williams Grove Ln
- 1000 Oakgate Ct
- 265 Williams Grove Ln
- 273 Williams Grove Ln Unit Lot 62
- 1006 Senoma Place
- 1009 Senoma Place
- 1009 Beringer Place
- 1004 Senoma Place
- 1007 Senoma Place
- 1007 Beringer Place
- 1005 Senoma Place
- 1010 Beringer Place
- 1002 Senoma Place
- 1008 W Saint Helena Place
- 1003 Senoma Place
- 1008 St Helena Place
- 1010 W Saint Helena Place
- 1005 Beringer Place
- 1309 Empty Nest Way
- 1006 W Saint Helena Place
- 1006 W Saint Helena Place Unit (UnitID 12684808)
- 1006 St Helena St
- 1006 St Helena Place
- 1313 Empty Nest Way