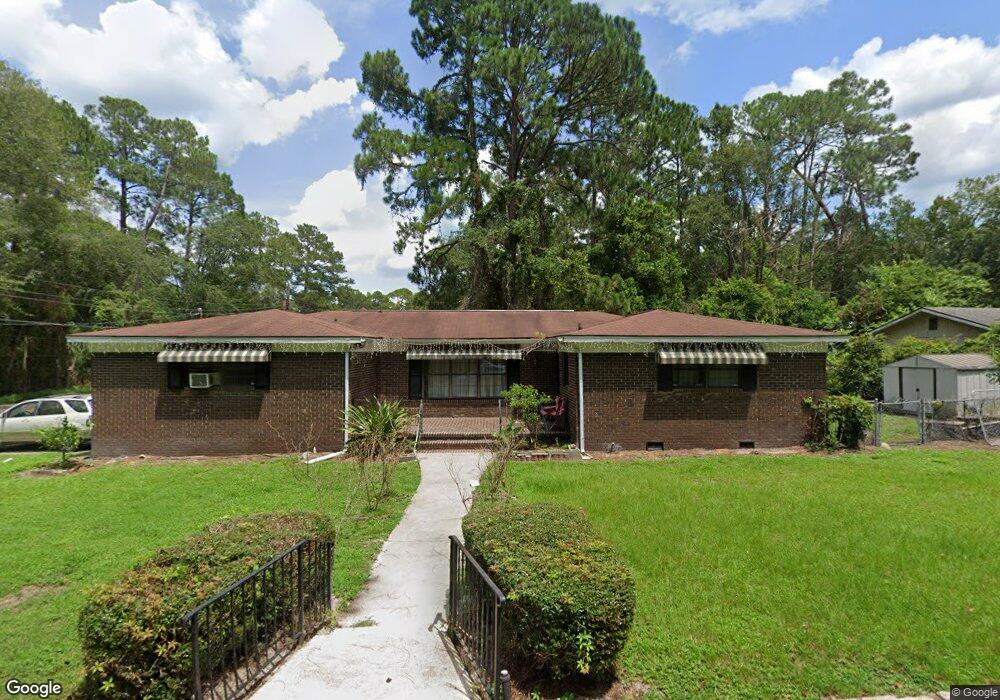
1008 Suwanee Dr Waycross, GA 31501
Estimated Value: $164,000 - $191,000
3
Beds
2
Baths
1,865
Sq Ft
$97/Sq Ft
Est. Value
About This Home
This home is located at 1008 Suwanee Dr, Waycross, GA 31501 and is currently estimated at $180,453, approximately $96 per square foot. 1008 Suwanee Dr is a home located in Ware County with nearby schools including Williams Heights Elementary School, Waycross Middle School, and Ware County High School.
Ownership History
Date
Name
Owned For
Owner Type
Purchase Details
Closed on
May 18, 2018
Sold by
Federal National Mortgage Association
Bought by
Nguyen Nuong
Current Estimated Value
Purchase Details
Closed on
Mar 7, 2017
Sold by
Brooks Sharon
Bought by
Federal National Mtg Associati
Purchase Details
Closed on
Nov 3, 2006
Sold by
Starn David C
Bought by
Brooks Sharon
Home Financials for this Owner
Home Financials are based on the most recent Mortgage that was taken out on this home.
Original Mortgage
$97,500
Interest Rate
6.25%
Mortgage Type
New Conventional
Purchase Details
Closed on
Jan 2, 2003
Sold by
Beall Richard and Tella Starn
Bought by
Beall Richard and David Starn
Purchase Details
Closed on
Mar 8, 2001
Sold by
Dixon Ann Morris Lee
Bought by
Beall Richard and Tella Starn
Purchase Details
Closed on
May 11, 1998
Sold by
Morris Madaleine Lee
Bought by
Dixon Ann Morris Lee
Purchase Details
Closed on
Jun 29, 1989
Bought by
Morris Madaleine Lee
Create a Home Valuation Report for This Property
The Home Valuation Report is an in-depth analysis detailing your home's value as well as a comparison with similar homes in the area
Purchase History
| Date | Buyer | Sale Price | Title Company |
|---|---|---|---|
| Nguyen Nuong | $69,000 | -- | |
| Nguyen Nuong | $69,000 | -- | |
| Federal National Mtg Associati | -- | -- | |
| Federal National Mtg Associati | -- | -- | |
| Brooks Sharon | $90,000 | -- | |
| Brooks Sharon | $90,000 | -- | |
| Beall Richard | -- | -- | |
| Beall Richard | -- | -- | |
| Beall Richard | $68,900 | -- | |
| Beall Richard | $68,900 | -- | |
| Dixon Ann Morris Lee | -- | -- | |
| Dixon Ann Morris Lee | -- | -- | |
| Morris Madaleine Lee | -- | -- | |
| Morris Madaleine Lee | -- | -- |
Source: Public Records
Mortgage History
| Date | Status | Borrower | Loan Amount |
|---|---|---|---|
| Previous Owner | Brooks Sharon | $97,500 |
Source: Public Records
Tax History
| Year | Tax Paid | Tax Assessment Tax Assessment Total Assessment is a certain percentage of the fair market value that is determined by local assessors to be the total taxable value of land and additions on the property. | Land | Improvement |
|---|---|---|---|---|
| 2025 | $1,996 | $59,078 | $3,360 | $55,718 |
| 2024 | $1,996 | $59,078 | $3,360 | $55,718 |
| 2023 | $2,037 | $51,206 | $2,258 | $48,948 |
| 2022 | $2,041 | $51,206 | $2,258 | $48,948 |
| 2021 | $1,822 | $42,130 | $2,258 | $39,872 |
| 2020 | $1,749 | $40,136 | $2,258 | $37,878 |
| 2019 | $1,642 | $37,146 | $2,258 | $34,888 |
| 2018 | $1,602 | $35,900 | $2,258 | $33,642 |
| 2017 | $1,565 | $35,900 | $2,258 | $33,642 |
| 2016 | $1,565 | $35,900 | $2,258 | $33,642 |
| 2015 | $1,576 | $35,900 | $2,258 | $33,642 |
| 2014 | $1,575 | $35,900 | $2,258 | $33,642 |
| 2013 | -- | $35,900 | $2,258 | $33,642 |
Source: Public Records
Map
Nearby Homes
- 713 Magnolia Dr
- 808 Euclid Ave
- 1205 Dean Dr
- 1100 Atlantic Ave
- 907 Euclid Ave
- 0 Saint Marys Dr Unit (TRACT 2 0.25 ACRES)
- 1009 Euclid Ave
- 1100 Euclid Ave
- 707 Euclid Ave
- 7438 Central Ave
- 1001 Coral Rd
- 1500 Saint Marys Dr
- 808 Satilla Blvd
- 1204 Richmond Ave
- 511 Richmond Ave
- 1501 Satilla Blvd
- 807 City Blvd
- 901 City Blvd
- 1004 Hill St
- 1602 Saint Marys Dr
- 1008 Suwanne Dr
- 902 Richmond Ave
- 1506 Suwanee Dr
- 1405 Suwanee Dr
- 1709 Suwanee Dr
- 1507 Suwanee Dr
- 1611 Suwanee Dr
- 1509 Suwanee Dr
- 901 Atlantic Ave
- 903 Atlantic Ave
- 810 Richmond Ave
- 809 Atlantic Ave
- 1100 Suwanne Dr
- 00 Richmond Ave
- 00 Richmond Ave
- 906 Richmond Ave
- 905 Atlantic Ave
- 807 809 Atlantic Ave
- 907 Atlantic Ave
- 907 Richmond Ave
Your Personal Tour Guide
Ask me questions while you tour the home.