1008 W Main Elwood, IN 46036
Estimated Value: $165,000 - $214,000
3
Beds
2
Baths
2,111
Sq Ft
$89/Sq Ft
Est. Value
About This Home
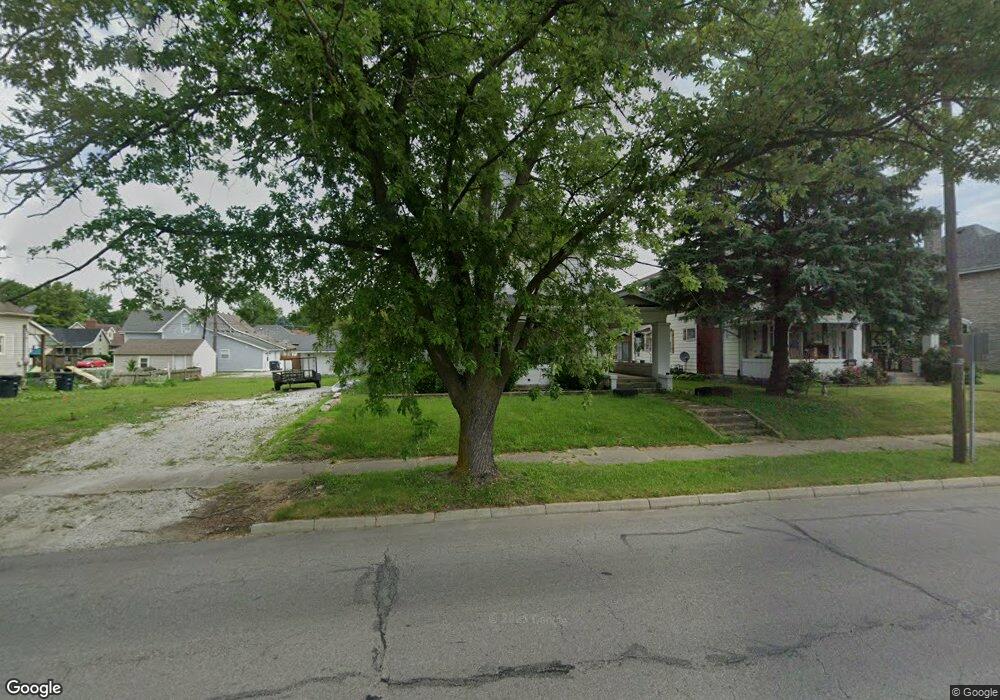
This home is located at 1008 W Main, Elwood, IN 46036 and is currently estimated at $188,893, approximately $89 per square foot. 1008 W Main is a home located in Madison County with nearby schools including Elwood Elementary School, Elwood Intermediate School, and Elwood Junior-Senior High School.
Ownership History
Date
Name
Owned For
Owner Type
Purchase Details
Closed on
Dec 21, 2021
Sold by
Stansberry Kasey and Stansberry Damon
Bought by
Fletcher Matthew S
Current Estimated Value
Home Financials for this Owner
Home Financials are based on the most recent Mortgage that was taken out on this home.
Original Mortgage
$132,887
Outstanding Balance
$121,495
Interest Rate
2.98%
Mortgage Type
VA
Estimated Equity
$67,398
Purchase Details
Closed on
Jun 14, 2021
Sold by
John Matthew and Ferguson Marni
Bought by
Stansberry Kasey and Stansberry Damon
Create a Home Valuation Report for This Property
The Home Valuation Report is an in-depth analysis detailing your home's value as well as a comparison with similar homes in the area
Home Values in the Area
Average Home Value in this Area
Purchase History
| Date | Buyer | Sale Price | Title Company |
|---|---|---|---|
| Fletcher Matthew S | $129,900 | None Available | |
| Stansberry Kasey | -- | None Available |
Source: Public Records
Mortgage History
| Date | Status | Borrower | Loan Amount |
|---|---|---|---|
| Open | Fletcher Matthew S | $132,887 |
Source: Public Records
Tax History Compared to Growth
Tax History
| Year | Tax Paid | Tax Assessment Tax Assessment Total Assessment is a certain percentage of the fair market value that is determined by local assessors to be the total taxable value of land and additions on the property. | Land | Improvement |
|---|---|---|---|---|
| 2025 | $1,219 | $121,900 | $13,400 | $108,500 |
| 2024 | $1,219 | $121,900 | $13,400 | $108,500 |
| 2023 | $1,117 | $111,100 | $12,800 | $98,300 |
| 2022 | $1,119 | $110,300 | $12,000 | $98,300 |
| 2021 | $1,018 | $101,200 | $12,000 | $89,200 |
| 2020 | $983 | $96,700 | $11,500 | $85,200 |
| 2019 | $959 | $94,300 | $11,500 | $82,800 |
| 2018 | $1,787 | $88,700 | $11,500 | $77,200 |
| 2017 | $889 | $88,300 | $11,500 | $76,800 |
| 2016 | $804 | $79,400 | $11,500 | $67,900 |
| 2014 | $782 | $78,200 | $11,500 | $66,700 |
| 2013 | $782 | $78,200 | $11,500 | $66,700 |
Source: Public Records
Map
Nearby Homes