Estimated Value: $532,000 - $570,000
4
Beds
3
Baths
2,150
Sq Ft
$257/Sq Ft
Est. Value
About This Home
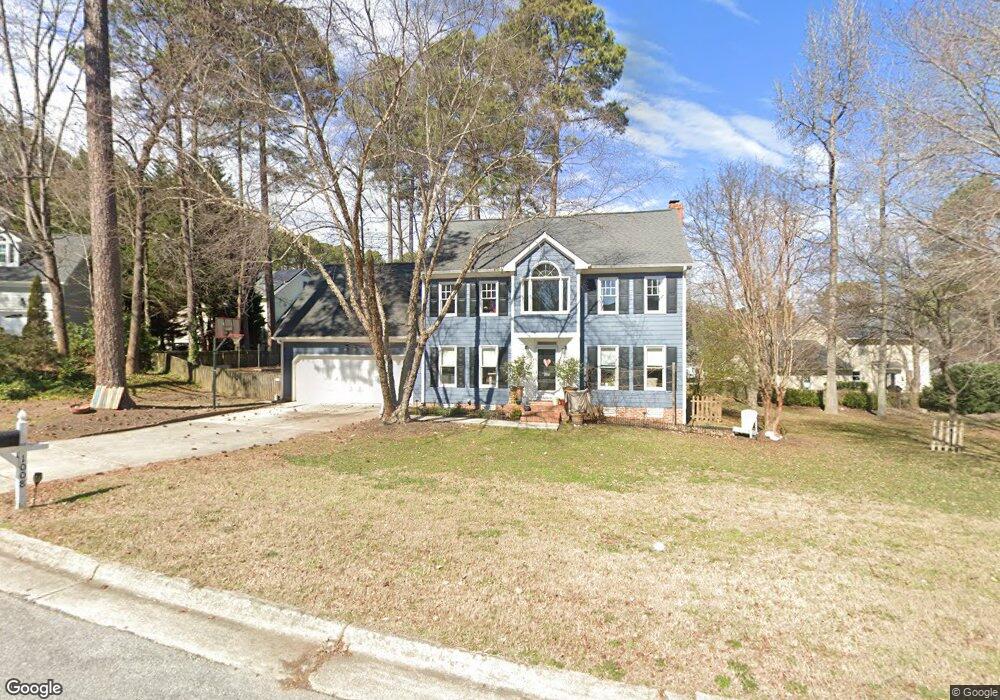
This home is located at 1008 W Saint Julian Place, Apex, NC 27502 and is currently estimated at $551,584, approximately $256 per square foot. 1008 W Saint Julian Place is a home located in Wake County with nearby schools including Apex Elementary School, Apex Middle, and Apex High School.
Ownership History
Date
Name
Owned For
Owner Type
Purchase Details
Closed on
Jul 14, 2009
Sold by
Warren Vance A and Warren Lora D
Bought by
Greene Thomas Joseph and Greene Ashley Dale
Current Estimated Value
Home Financials for this Owner
Home Financials are based on the most recent Mortgage that was taken out on this home.
Original Mortgage
$191,600
Outstanding Balance
$114,786
Interest Rate
3.75%
Mortgage Type
New Conventional
Estimated Equity
$436,798
Purchase Details
Closed on
Jul 19, 2000
Sold by
Gadwah Brian I
Bought by
Warren Vance A and Warren Lora D
Home Financials for this Owner
Home Financials are based on the most recent Mortgage that was taken out on this home.
Original Mortgage
$183,715
Interest Rate
8.23%
Mortgage Type
VA
Create a Home Valuation Report for This Property
The Home Valuation Report is an in-depth analysis detailing your home's value as well as a comparison with similar homes in the area
Home Values in the Area
Average Home Value in this Area
Purchase History
| Date | Buyer | Sale Price | Title Company |
|---|---|---|---|
| Greene Thomas Joseph | $213,000 | None Available | |
| Warren Vance A | $196,000 | -- |
Source: Public Records
Mortgage History
| Date | Status | Borrower | Loan Amount |
|---|---|---|---|
| Open | Greene Thomas Joseph | $191,600 | |
| Previous Owner | Warren Vance A | $183,715 |
Source: Public Records
Tax History Compared to Growth
Tax History
| Year | Tax Paid | Tax Assessment Tax Assessment Total Assessment is a certain percentage of the fair market value that is determined by local assessors to be the total taxable value of land and additions on the property. | Land | Improvement |
|---|---|---|---|---|
| 2025 | $4,430 | $505,084 | $200,000 | $305,084 |
| 2024 | $4,331 | $505,084 | $200,000 | $305,084 |
| 2023 | $3,371 | $305,511 | $70,000 | $235,511 |
| 2022 | $3,165 | $305,511 | $70,000 | $235,511 |
| 2021 | $3,045 | $305,511 | $70,000 | $235,511 |
| 2020 | $3,014 | $305,511 | $70,000 | $235,511 |
| 2019 | $2,890 | $252,744 | $70,000 | $182,744 |
| 2018 | $2,723 | $252,744 | $70,000 | $182,744 |
| 2017 | $2,535 | $252,744 | $70,000 | $182,744 |
| 2016 | $2,498 | $252,744 | $70,000 | $182,744 |
| 2015 | $2,405 | $237,475 | $62,000 | $175,475 |
| 2014 | $2,319 | $237,475 | $62,000 | $175,475 |
Source: Public Records
Map
Nearby Homes
- 4006 New Yarmouth Way
- 295 Williams Grove Ln Unit Lot 67
- 214 Williams Grove Ln Unit Lot 4
- 218 Williams Grove Ln
- 226 Williams Grove Ln
- 262 Williams Grove Ln Unit Lot 76
- 278 Williams Grove Ln Unit Lot 73
- 286 Williams Grove Ln Unit Lot 71
- 294 Williams Grove Ln Unit 69
- 294 Williams Grove Ln
- 298 Williams Grove Ln N Unit 68
- 285 Williams Grove Ln Unit Lot 65
- 281 Williams Grove Ln Unit Lot 64
- 281 Williams Grove Ln
- 635 Sawcut Ln
- 631 Sawcut Ln
- 633 Sawcut Ln
- 265 Williams Grove Ln
- 273 Williams Grove Ln Unit Lot 62
- 1511 Waterland Dr
- 1008 St Julian Place
- 1007 W Saint Helena Place
- 1004 W Saint Julian Place
- 1010 W Saint Julian Place
- 1009 W Saint Helena Place
- 1009 W Saint Julian Place
- 1012 W Saint Julian Place
- 1007 W Saint Julian Place
- 1011 W Saint Julian Place
- 1011 St Helena Place
- 1002 W Saint Julian Place
- 1011 W Saint Helena Place
- 1003 W Saint Helena Place
- 1005 W Saint Julian Place
- 1006 St Helena Place
- 1006 St Helena St
- 1006 W Saint Helena Place
- 1006 W Saint Helena Place Unit (UnitID 12684808)
- 1003 W Saint Julian Place
- 1010 W Saint Helena Place