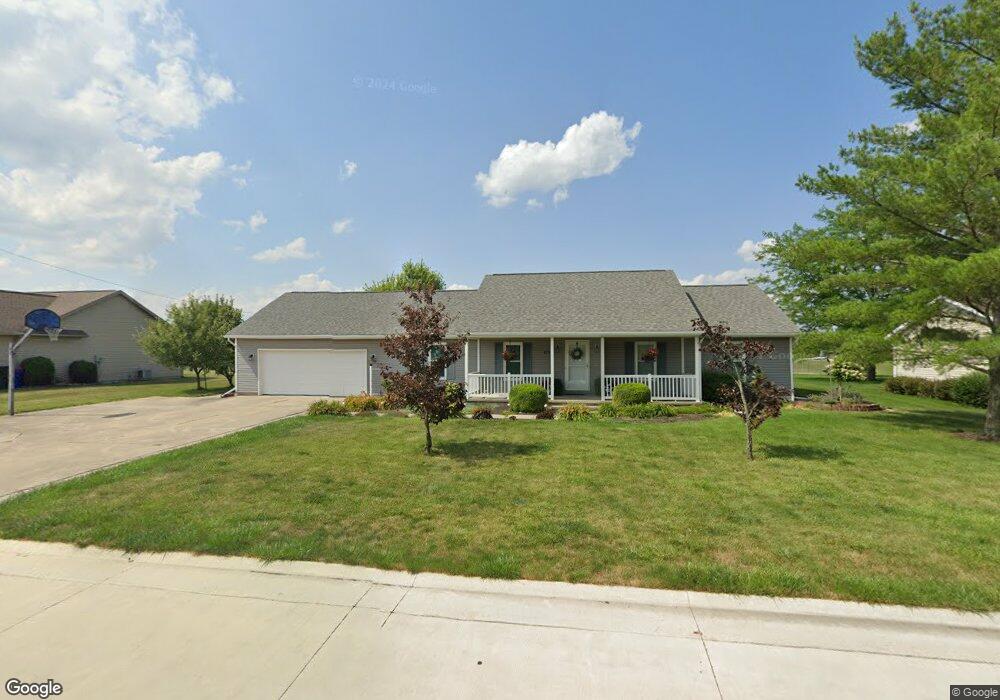
1008 William Ave Delphos, OH 45833
Estimated Value: $250,356 - $335,000
3
Beds
2
Baths
1,560
Sq Ft
$190/Sq Ft
Est. Value
About This Home
This home is located at 1008 William Ave, Delphos, OH 45833 and is currently estimated at $296,339, approximately $189 per square foot. 1008 William Ave is a home located in Van Wert County with nearby schools including Delphos St. John's High School and Delphos St. John's Elementary School.
Ownership History
Date
Name
Owned For
Owner Type
Purchase Details
Closed on
Dec 22, 2015
Sold by
Lindeman Terry M and Lindeman Doris M
Bought by
Linder Elizabeth A
Current Estimated Value
Home Financials for this Owner
Home Financials are based on the most recent Mortgage that was taken out on this home.
Original Mortgage
$160,000
Outstanding Balance
$66,079
Interest Rate
3.96%
Mortgage Type
Purchase Money Mortgage
Estimated Equity
$230,260
Purchase Details
Closed on
Dec 23, 2012
Bought by
Linder Elizabeth A
Purchase Details
Closed on
Oct 8, 2009
Sold by
Hefner Gary N and Hefner Linda K
Bought by
Lindeman Terry M and Lindeman Doris M
Home Financials for this Owner
Home Financials are based on the most recent Mortgage that was taken out on this home.
Original Mortgage
$132,000
Interest Rate
5.19%
Mortgage Type
New Conventional
Purchase Details
Closed on
Jul 1, 1998
Bought by
Hefner Gary N and Hefner Linda K
Create a Home Valuation Report for This Property
The Home Valuation Report is an in-depth analysis detailing your home's value as well as a comparison with similar homes in the area
Home Values in the Area
Average Home Value in this Area
Purchase History
| Date | Buyer | Sale Price | Title Company |
|---|---|---|---|
| Linder Elizabeth A | $170,000 | Attorney | |
| Linder Elizabeth A | $170,000 | -- | |
| Lindeman Terry M | $165,000 | Attorney | |
| Hefner Gary N | $121,000 | -- | |
| Hefner Gary N | $121,000 | -- |
Source: Public Records
Mortgage History
| Date | Status | Borrower | Loan Amount |
|---|---|---|---|
| Open | Linder Elizabeth A | $160,000 | |
| Previous Owner | Lindeman Terry M | $132,000 |
Source: Public Records
Tax History
| Year | Tax Paid | Tax Assessment Tax Assessment Total Assessment is a certain percentage of the fair market value that is determined by local assessors to be the total taxable value of land and additions on the property. | Land | Improvement |
|---|---|---|---|---|
| 2024 | $1,989 | $70,650 | $11,180 | $59,470 |
| 2023 | $1,983 | $70,650 | $11,180 | $59,470 |
| 2022 | $1,844 | $60,100 | $6,750 | $53,350 |
| 2021 | $1,850 | $60,100 | $6,750 | $53,350 |
| 2020 | $1,899 | $60,100 | $6,750 | $53,350 |
| 2019 | $1,483 | $51,890 | $6,750 | $45,140 |
| 2018 | $1,487 | $51,890 | $6,750 | $45,140 |
| 2017 | $1,494 | $51,890 | $6,750 | $45,140 |
| 2016 | $1,442 | $50,770 | $6,750 | $44,020 |
| 2015 | $1,442 | $50,770 | $6,750 | $44,020 |
| 2014 | $1,513 | $50,770 | $6,750 | $44,020 |
| 2013 | $1,613 | $50,770 | $6,750 | $44,020 |
Source: Public Records
Map
Nearby Homes
- 537 / 539 Toomey
- 10429 Ohio 66
- 709 W 4th St
- 409 N Bredeick St
- 708 W 1st St
- 629 N Main St
- 702 N Main St
- 610 N Washington St
- 201 E 5th St
- 405 N Franklin St
- 704 N Franklin St
- 420 S Cass St
- 221 S Main St
- 424 S Canal St
- 483 S Franklin St
- 310 E Suthoff St
- 821 E 3rd St
- 827 S Washington St
- 241 King St
- 1000 Colettas Way
- 1006 William Ave
- 1100 William Ave
- 1007 William Ave
- 1004 William Ave
- 1102 William Ave
- 1105 William Ave
- 511 William Ave
- 511 William Dr
- 511 William Ave
- 508 Menke St
- 509 William Ave
- 600 William Ave
- 507 Menke St
- 900 William Ave
- 510 William Ave
- 620 William Ave
- 508 William Ave
- 506 Menke St
- 507 William Ave
- 1125 William Ave
Your Personal Tour Guide
Ask me questions while you tour the home.