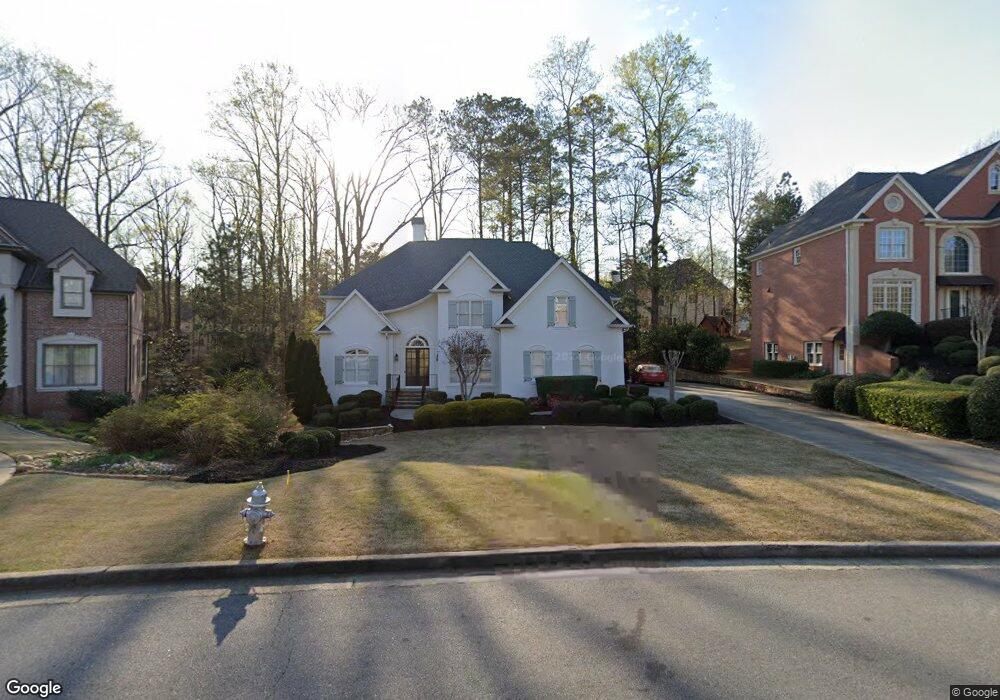
10080 High Falls Point Johns Creek, GA 30022
Estimated Value: $1,163,511 - $1,275,000
5
Beds
5
Baths
4,467
Sq Ft
$275/Sq Ft
Est. Value
About This Home
This home is located at 10080 High Falls Point, Johns Creek, GA 30022 and is currently estimated at $1,228,128, approximately $274 per square foot. 10080 High Falls Point is a home located in Fulton County with nearby schools including Dolvin Elementary School, Autrey Mill Middle School, and Johns Creek High School.
Ownership History
Date
Name
Owned For
Owner Type
Purchase Details
Closed on
Feb 14, 2022
Sold by
Krause Matthew D
Bought by
Sanchez Carlos E and Tamayo Michelle
Current Estimated Value
Purchase Details
Closed on
Feb 26, 2019
Sold by
Powers Terry L
Bought by
Krause Matthew D and Krause Alisson B
Home Financials for this Owner
Home Financials are based on the most recent Mortgage that was taken out on this home.
Original Mortgage
$317,500
Interest Rate
4.4%
Purchase Details
Closed on
Aug 25, 1997
Sold by
Doug Banner Homes Llc
Bought by
Powers Terry L
Home Financials for this Owner
Home Financials are based on the most recent Mortgage that was taken out on this home.
Original Mortgage
$320,250
Interest Rate
7.46%
Mortgage Type
New Conventional
Purchase Details
Closed on
Aug 1, 1996
Sold by
David Sewell Inc
Bought by
Brock Larry L Delores D
Create a Home Valuation Report for This Property
The Home Valuation Report is an in-depth analysis detailing your home's value as well as a comparison with similar homes in the area
Home Values in the Area
Average Home Value in this Area
Purchase History
| Date | Buyer | Sale Price | Title Company |
|---|---|---|---|
| Sanchez Carlos E | $935,000 | -- | |
| Krause Matthew D | $617,500 | -- | |
| Powers Terry L | $400,300 | -- | |
| Brock Larry L Delores D | $406,000 | -- |
Source: Public Records
Mortgage History
| Date | Status | Borrower | Loan Amount |
|---|---|---|---|
| Previous Owner | Krause Matthew D | $317,500 | |
| Previous Owner | Powers Terry L | $320,250 | |
| Closed | Brock Larry L Delores D | $0 |
Source: Public Records
Tax History Compared to Growth
Tax History
| Year | Tax Paid | Tax Assessment Tax Assessment Total Assessment is a certain percentage of the fair market value that is determined by local assessors to be the total taxable value of land and additions on the property. | Land | Improvement |
|---|---|---|---|---|
| 2025 | $7,972 | $373,480 | $80,000 | $293,480 |
| 2023 | $10,542 | $373,480 | $83,080 | $290,400 |
| 2022 | $2,971 | $268,000 | $70,960 | $197,040 |
| 2021 | $7,784 | $263,520 | $66,880 | $196,640 |
| 2020 | $7,562 | $247,000 | $62,640 | $184,360 |
| 2019 | $836 | $255,800 | $64,920 | $190,880 |
| 2018 | $7,578 | $249,800 | $63,400 | $186,400 |
| 2017 | $6,848 | $213,360 | $50,400 | $162,960 |
| 2016 | $6,741 | $213,360 | $50,400 | $162,960 |
| 2015 | $6,815 | $213,360 | $50,400 | $162,960 |
| 2014 | $7,065 | $213,360 | $50,400 | $162,960 |
Source: Public Records
Map
Nearby Homes
- 115 Thome Dr
- 350 Waters Bend Way
- 125 Oak Bridge Ct Unit 2
- 3815 Falls Landing Dr
- 10090 Jones Bridge Rd Unit 8
- 510 Winborne Place Unit VI
- 10415 Plantation Bridge Dr
- 320 Outwood Mill Ct
- 170 Autry Trail
- 10405 Meadow Crest Ln
- 120 Thome Dr
- 10050 Lauren Hall Ct
- 10325 Oxford Mill Cir Unit 1
- 130 Colony Run
- 10000 Barston Ct
- 9925 Lauren Hall Ct
- 10515 Colony Glen Dr Unit 2
- 2005 Westbourne Way Unit 2
- 3765 Redcoat Way
- 415 Wood Trace Ct
- 10080 High Falls Pointe
- 10080 High Falls Pte
- 10070 High Falls Pointe Unit 4
- 10090 High Falls Point
- 10090 High Falls Pointe
- 230 Azalea Cove Ln Unit 4
- 10060 High Falls Pointe
- 10060 High Falls Point Unit 1
- 10060 High Falls Point
- 240 Azalea Cove Ln
- 10075 High Falls Pointe Unit 4
- 10100 High Falls Pointe Unit 4
- 220 Azalea Cove Ln
- 10065 High Falls Pointe Unit 1
- 10085 High Falls Point Unit 4
- 10085 High Falls Point
- 10085 High Falls Pointe
- 10050 High Falls Pointe Unit 1
- 10095 High Falls Point
- 10095 High Falls Pointe