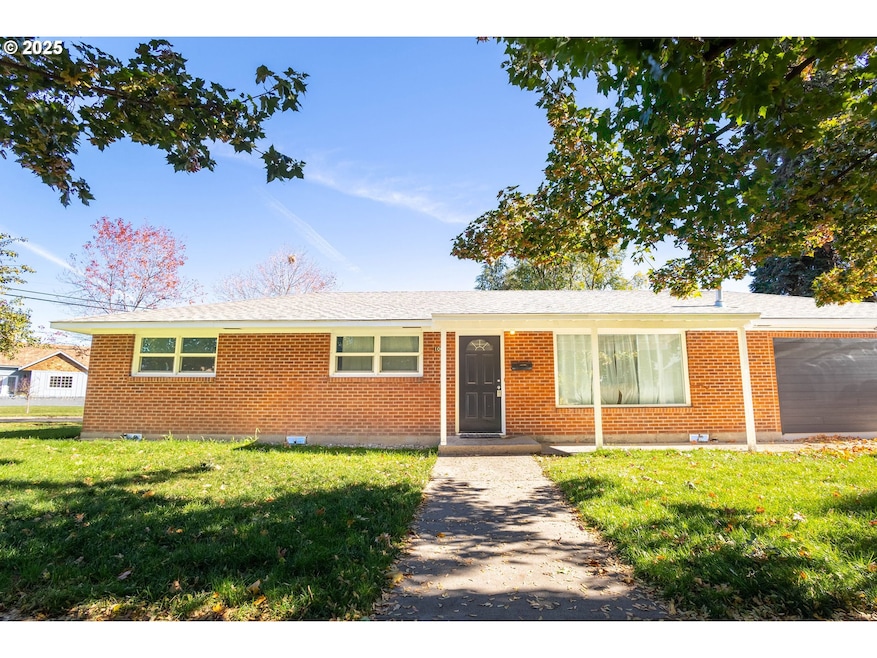


1009 13th St La Grande, OR 97850
Estimated payment $2,193/month
Highlights
- Deck
- Private Yard
- Converted Garage
- Corner Lot
- No HOA
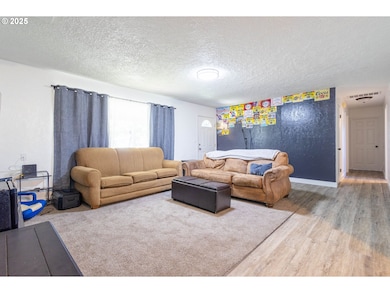
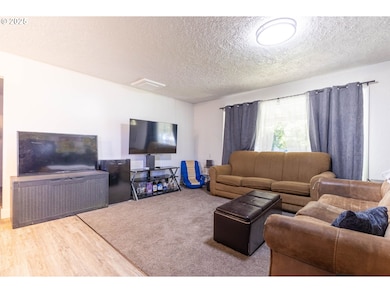
- Living Room
About This Home
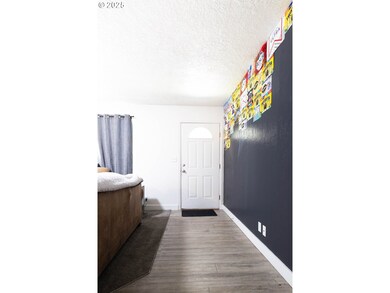
This isn’t your typical remodel—it’s a full refresh with purpose. With five true bedrooms and three bathrooms, this corner-lot home offers room for everyone and everything. Need space for a home office, a guest suite, or just a little breathing room? You’ve got it.This brick beauty has been thoughtfully updated throughout, from the modern finishes inside to the new underground sprinkler system that keeps the yard green and effortless. Enjoy the deck for quiet mornings or casual gatherings, off-street parking for three, and a newer outbuilding that adds bonus storage or hobby space.Currently rented and generating excellent income, this property is a solid investment from day one. Or, if you’re ready to make it home, it’s waiting with open arms—freshly remodeled, move-in ready, and packed with potential. Whether you live in it or let it work for you, this property is a win either way!
Listing Agent
RE/MAX Real Estate Team Brokerage Phone: 541-963-1000 License #201208312 Listed on: 10/20/2025

Home Details
Home Type
- Single Family
Est. Annual Taxes
- $3,665
Year Built
- Built in 1958 | Remodeled
Lot Details
- 6,098 Sq Ft Lot
- Corner Lot
- Sprinkler System
- Private Yard
Home Design
- Brick Exterior Construction
- Composition Roof
- Cement Siding
Interior Spaces
- 1,700 Sq Ft Home
- 1-Story Property
- Family Room
- Living Room
- Dining Room
- Crawl Space
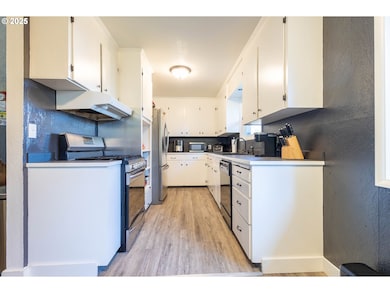
Kitchen
- Free-Standing Gas Range
- Disposal
Bedrooms and Bathrooms
- 5 Bedrooms
- 3 Full Bathrooms
Parking
- Parking Pad
- Converted Garage
- Off-Street Parking
Accessible Home Design
- Accessibility Features
- Level Entry For Accessibility
Outdoor Features
- Deck
- Outbuilding
Schools
- Central Elementary School
- La Grande Middle School
- La Grande High School
Utilities
- Forced Air Zoned Heating and Cooling System
- Heating System Uses Gas
- Heating System Mounted To A Wall or Window
- Gas Water Heater
Community Details
- No Home Owners Association
Listing and Financial Details
- Assessor Parcel Number 3320
Map
Home Values in the Area
Average Home Value in this Area
Tax History
| Year | Tax Paid | Tax Assessment Tax Assessment Total Assessment is a certain percentage of the fair market value that is determined by local assessors to be the total taxable value of land and additions on the property. | Land | Improvement |
|---|---|---|---|---|
| 2025 | $3,794 | $209,660 | $68,730 | $140,930 |
| 2024 | $3,665 | $203,560 | $66,730 | $136,830 |
| 2023 | $3,600 | $197,640 | $64,790 | $132,850 |
| 2022 | $3,147 | $172,337 | $62,909 | $109,428 |
| 2021 | $3,067 | $167,318 | $61,465 | $105,853 |
| 2020 | $2,818 | $162,445 | $59,702 | $102,743 |
| 2019 | $2,819 | $157,714 | $58,091 | $99,623 |
| 2018 | $2,720 | $153,121 | $49,549 | $103,572 |
| 2017 | $2,706 | $148,662 | $48,462 | $100,200 |
| 2016 | $2,543 | $144,333 | $47,174 | $97,159 |
| 2015 | $2,351 | $140,130 | $45,867 | $94,263 |
| 2014 | $2,078 | $136,049 | $44,624 | $91,425 |
| 2013 | -- | $132,087 | $43,297 | $88,790 |
Property History
| Date | Event | Price | List to Sale | Price per Sq Ft |
|---|---|---|---|---|
| 11/24/2025 11/24/25 | Price Changed | $359,900 | -0.7% | $212 / Sq Ft |
| 10/20/2025 10/20/25 | For Sale | $362,500 | -- | $213 / Sq Ft |
Purchase History
| Date | Type | Sale Price | Title Company |
|---|---|---|---|
| Warranty Deed | $155,000 | Eastern Oregon Title Inc | |
| Warranty Deed | $100,500 | Eastern Oregon Title Inc | |
| Warranty Deed | $128,500 | Atco |
Mortgage History
| Date | Status | Loan Amount | Loan Type |
|---|---|---|---|
| Open | $158,332 | New Conventional | |
| Previous Owner | $97,951 | FHA |
Source: Regional Multiple Listing Service (RMLS)
MLS Number: 387542397
APN: 03S3808AC-7800-0-101
Disclaimer: Certain information contained herein is derived from information provided by parties other than Homes.com. All information provided is deemed reliable, but is not guaranteed to be accurate and should be independently verified.
![]() The content relating to real estate for sale on this web site comes in part from the IDX program of the RMLS™ of Portland, Oregon. Real estate listings held by brokerage firms other than Ten-X are marked with the RMLS™ logo, and detailed information about these properties includes the names of the listing brokers. Listing content is copyright © 2025 RMLS™, Portland, Oregon. Some properties which appear for sale on this web site may subsequently have sold or may no longer be available. All information provided is deemed reliable but is not guaranteed and should be independently verified.
The content relating to real estate for sale on this web site comes in part from the IDX program of the RMLS™ of Portland, Oregon. Real estate listings held by brokerage firms other than Ten-X are marked with the RMLS™ logo, and detailed information about these properties includes the names of the listing brokers. Listing content is copyright © 2025 RMLS™, Portland, Oregon. Some properties which appear for sale on this web site may subsequently have sold or may no longer be available. All information provided is deemed reliable but is not guaranteed and should be independently verified.