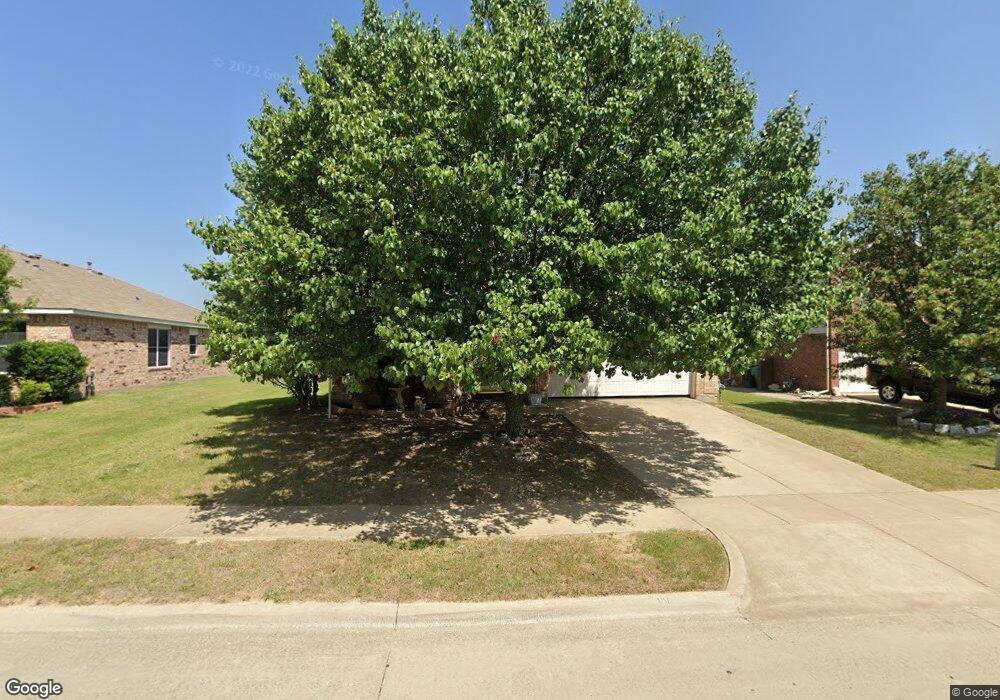
1009 Blue Jay Ln Sherman, TX 75092
Estimated Value: $283,000 - $300,155
--
Bed
--
Bath
1,889
Sq Ft
$154/Sq Ft
Est. Value
About This Home
This home is located at 1009 Blue Jay Ln, Sherman, TX 75092 and is currently estimated at $291,578, approximately $154 per square foot. 1009 Blue Jay Ln is a home located in Grayson County with nearby schools including Henry W. Sory Elementary School, Piner Middle School, and Dillingham Intermediate School.
Ownership History
Date
Name
Owned For
Owner Type
Purchase Details
Closed on
May 8, 2023
Sold by
Reppond Thomas W
Bought by
Reppond Thomas W
Current Estimated Value
Home Financials for this Owner
Home Financials are based on the most recent Mortgage that was taken out on this home.
Original Mortgage
$427,500
Outstanding Balance
$414,040
Interest Rate
5.7%
Mortgage Type
Reverse Mortgage Home Equity Conversion Mortgage
Estimated Equity
-$122,462
Purchase Details
Closed on
Sep 23, 2005
Sold by
Pulte Homes Of Texas Lp
Bought by
Reppond Thomas W and Reppond Jackie M
Home Financials for this Owner
Home Financials are based on the most recent Mortgage that was taken out on this home.
Original Mortgage
$67,950
Interest Rate
5.76%
Mortgage Type
Fannie Mae Freddie Mac
Create a Home Valuation Report for This Property
The Home Valuation Report is an in-depth analysis detailing your home's value as well as a comparison with similar homes in the area
Home Values in the Area
Average Home Value in this Area
Purchase History
| Date | Buyer | Sale Price | Title Company |
|---|---|---|---|
| Reppond Thomas W | -- | Simplified Title | |
| Reppond Thomas W | -- | -- |
Source: Public Records
Mortgage History
| Date | Status | Borrower | Loan Amount |
|---|---|---|---|
| Open | Reppond Thomas W | $427,500 | |
| Closed | Reppond Thomas W | $427,500 | |
| Previous Owner | Reppond Thomas W | $67,950 |
Source: Public Records
Tax History Compared to Growth
Tax History
| Year | Tax Paid | Tax Assessment Tax Assessment Total Assessment is a certain percentage of the fair market value that is determined by local assessors to be the total taxable value of land and additions on the property. | Land | Improvement |
|---|---|---|---|---|
| 2025 | $909 | $267,097 | -- | -- |
| 2024 | $5,326 | $242,815 | $0 | $0 |
| 2023 | $909 | $220,741 | $0 | $0 |
| 2022 | $4,703 | $200,674 | $0 | $0 |
| 2021 | $4,573 | $182,431 | $32,413 | $150,018 |
| 2020 | $4,646 | $177,008 | $22,041 | $154,967 |
| 2019 | $4,670 | $173,250 | $15,323 | $157,927 |
| 2018 | $4,147 | $166,478 | $15,323 | $151,155 |
| 2017 | $3,740 | $156,396 | $15,323 | $141,073 |
| 2016 | $3,400 | $148,524 | $15,323 | $133,201 |
| 2015 | $0 | $124,175 | $23,552 | $100,623 |
| 2014 | -- | $121,480 | $23,552 | $97,928 |
Source: Public Records
Map
Nearby Homes
- 4507 Falcon Dr
- 4501 Hawk Ln
- 1407 Swan Ridge Dr
- Perlino Plan at The Preserve At Country Ridge
- Saddlebred Plan at The Preserve At Country Ridge
- Sable Plan at The Preserve At Country Ridge
- Highland Plan at The Preserve At Country Ridge
- Appaloosa Plan at The Preserve At Country Ridge
- Gotland Plan at The Preserve At Country Ridge
- Mustang Plan at The Preserve At Country Ridge
- Shetland Plan at The Preserve At Country Ridge
- Oberlander Plan at The Preserve At Country Ridge
- Nez Perce Plan at The Preserve At Country Ridge
- Clydesdale Plan at The Preserve At Country Ridge
- Fredericksburg Plan at The Preserve At Country Ridge
- Fjord Plan at The Preserve At Country Ridge
- Cumberland Plan at The Preserve At Country Ridge
- Morab Plan at The Preserve At Country Ridge
- Overo Plan at The Preserve At Country Ridge
- Fresian Plan at The Preserve At Country Ridge
- 1005 Blue Jay Ln
- 1013 Blue Jay Ln
- 1102 Swan Ridge Dr
- 1008 Swan Ridge Dr
- 1001 Blue Jay Ln
- 1106 Swan Ridge Dr
- 1017 Blue Jay Ln
- 1004 Swan Ridge Dr
- 4501 Blue Jay Ln
- 4502 Quail Run Rd
- 4500 Blue Jay Ln
- 4504 Blue Jay Ln
- 4505 Blue Jay Ln
- 1000 Swan Ridge Dr
- 4506 Quail Run Rd
- 1110 Swan Ridge Dr
- 4510 Quail Run Rd
- 4330 Cardinal Dr
- 4407 Falcon Dr
- 4509 Blue Jay Ln