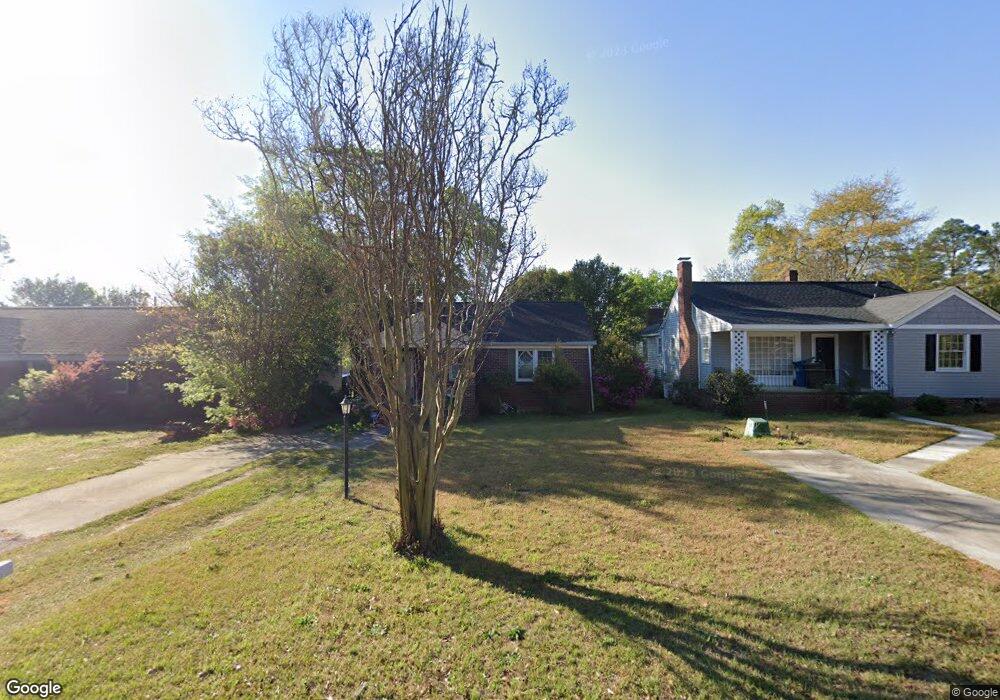
1009 D Ave West Columbia, SC 29169
Estimated Value: $235,000 - $294,000
3
Beds
2
Baths
1,550
Sq Ft
$170/Sq Ft
Est. Value
About This Home
This home is located at 1009 D Ave, West Columbia, SC 29169 and is currently estimated at $262,786, approximately $169 per square foot. 1009 D Ave is a home located in Lexington County with nearby schools including Cayce Elementary, Cyril B. Busbee Creative Arts Academy, and Brookland-Cayce High School.
Ownership History
Date
Name
Owned For
Owner Type
Purchase Details
Closed on
May 31, 2019
Sold by
Kelly Ryan D
Bought by
Kelly Patrick B
Current Estimated Value
Home Financials for this Owner
Home Financials are based on the most recent Mortgage that was taken out on this home.
Original Mortgage
$133,536
Outstanding Balance
$118,339
Interest Rate
4.5%
Mortgage Type
FHA
Estimated Equity
$144,447
Purchase Details
Closed on
Feb 4, 2008
Sold by
Sandifer Geoffrey D
Bought by
Kelly Ryan D
Home Financials for this Owner
Home Financials are based on the most recent Mortgage that was taken out on this home.
Original Mortgage
$160,481
Interest Rate
6.06%
Mortgage Type
FHA
Purchase Details
Closed on
Jul 5, 2005
Sold by
Fitzgerald Timothy M and Fitzgerald Erin
Bought by
Sandifer Geoffrey D
Home Financials for this Owner
Home Financials are based on the most recent Mortgage that was taken out on this home.
Original Mortgage
$22,125
Interest Rate
5.46%
Mortgage Type
Credit Line Revolving
Create a Home Valuation Report for This Property
The Home Valuation Report is an in-depth analysis detailing your home's value as well as a comparison with similar homes in the area
Home Values in the Area
Average Home Value in this Area
Purchase History
| Date | Buyer | Sale Price | Title Company |
|---|---|---|---|
| Kelly Patrick B | $136,000 | None Available | |
| Kelly Ryan D | $163,000 | None Available | |
| Sandifer Geoffrey D | $147,500 | -- |
Source: Public Records
Mortgage History
| Date | Status | Borrower | Loan Amount |
|---|---|---|---|
| Open | Kelly Patrick B | $133,536 | |
| Previous Owner | Kelly Ryan D | $160,481 | |
| Previous Owner | Sandifer Geoffrey D | $22,125 |
Source: Public Records
Tax History Compared to Growth
Tax History
| Year | Tax Paid | Tax Assessment Tax Assessment Total Assessment is a certain percentage of the fair market value that is determined by local assessors to be the total taxable value of land and additions on the property. | Land | Improvement |
|---|---|---|---|---|
| 2024 | $1,040 | $5,440 | $1,400 | $4,040 |
| 2023 | $1,040 | $5,440 | $1,400 | $4,040 |
| 2022 | $1,050 | $5,440 | $1,400 | $4,040 |
| 2020 | $1,008 | $5,440 | $1,400 | $4,040 |
| 2019 | $777 | $4,106 | $1,192 | $2,914 |
| 2018 | $2,188 | $6,159 | $1,788 | $4,371 |
| 2017 | $2,147 | $6,159 | $1,788 | $4,371 |
| 2016 | $2,172 | $4,106 | $1,192 | $2,914 |
| 2014 | $595 | $4,154 | $1,120 | $3,034 |
| 2013 | -- | $4,150 | $1,120 | $3,030 |
Source: Public Records
Map
Nearby Homes
- 1011 D Ave
- 930 C Ave
- 908 B Ave
- 1028 Augusta St
- 1224 Evergreen Ave
- Tract 1 Hallelujah Rd
- 928 Indigo Ave
- 1041 Indigo Ave
- 827 Indigo Ave
- 1310 Karlaney Ave
- 1235 Jensen St
- 706 Violet St
- 1301 Karlaney Ave
- 606 C Ave
- 1452 C Ave
- 1246 Lafayette Ave
- 900 Michaelmas (Aka M) Ave
- 324 N Parson St
- 1610 D Ave
- 1015 Naples Ave