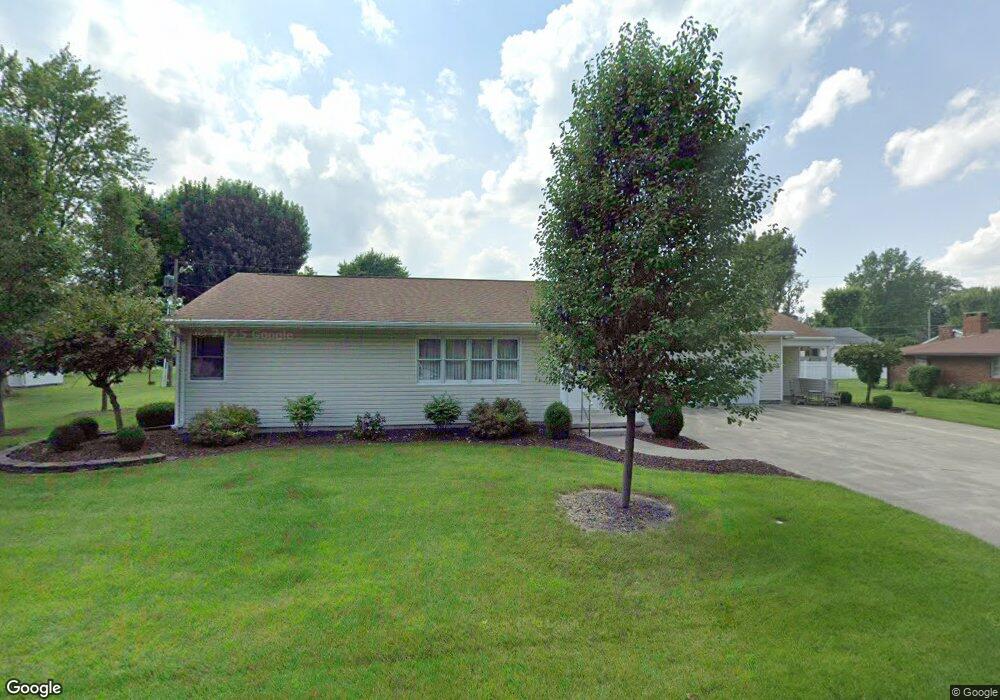
1009 Dickman Ave Delphos, OH 45833
Estimated Value: $138,000 - $191,000
2
Beds
2
Baths
1,540
Sq Ft
$112/Sq Ft
Est. Value
About This Home
This home is located at 1009 Dickman Ave, Delphos, OH 45833 and is currently estimated at $172,276, approximately $111 per square foot. 1009 Dickman Ave is a home located in Van Wert County with nearby schools including Delphos St. John's High School and Delphos St. John's Elementary School.
Ownership History
Date
Name
Owned For
Owner Type
Purchase Details
Closed on
Sep 13, 2024
Sold by
Giller Zakary B
Bought by
Giller Zakary B and Wrasman Amanda Lynn
Current Estimated Value
Home Financials for this Owner
Home Financials are based on the most recent Mortgage that was taken out on this home.
Original Mortgage
$121,600
Interest Rate
6.99%
Mortgage Type
New Conventional
Purchase Details
Closed on
Jul 19, 2024
Sold by
Cedar Grove Investments Llc
Bought by
Giller Zakary B
Home Financials for this Owner
Home Financials are based on the most recent Mortgage that was taken out on this home.
Original Mortgage
$121,600
Interest Rate
6.99%
Mortgage Type
New Conventional
Purchase Details
Closed on
Nov 24, 2021
Sold by
Bergfeld Mary Agnes and Bergfeld Claude A
Bought by
Cedar Grove Investments Llc
Purchase Details
Closed on
Apr 23, 2004
Bought by
Bergfeld Mary Agnes and Bergfeld Claude A
Create a Home Valuation Report for This Property
The Home Valuation Report is an in-depth analysis detailing your home's value as well as a comparison with similar homes in the area
Home Values in the Area
Average Home Value in this Area
Purchase History
| Date | Buyer | Sale Price | Title Company |
|---|---|---|---|
| Giller Zakary B | -- | None Listed On Document | |
| Giller Zakary B | $128,000 | Benchmark Title | |
| Cedar Grove Investments Llc | $190,750 | None Available | |
| Bergfeld Mary Agnes | -- | -- |
Source: Public Records
Mortgage History
| Date | Status | Borrower | Loan Amount |
|---|---|---|---|
| Previous Owner | Giller Zakary B | $121,600 |
Source: Public Records
Tax History
| Year | Tax Paid | Tax Assessment Tax Assessment Total Assessment is a certain percentage of the fair market value that is determined by local assessors to be the total taxable value of land and additions on the property. | Land | Improvement |
|---|---|---|---|---|
| 2024 | $1,339 | $47,450 | $7,480 | $39,970 |
| 2023 | $1,335 | $47,450 | $7,480 | $39,970 |
| 2022 | $1,062 | $33,460 | $6,470 | $26,990 |
| 2021 | $719 | $31,830 | $6,470 | $25,360 |
| 2020 | $742 | $31,830 | $6,470 | $25,360 |
| 2019 | $623 | $30,420 | $6,470 | $23,950 |
| 2018 | $628 | $30,420 | $6,470 | $23,950 |
| 2017 | $628 | $30,420 | $6,470 | $23,950 |
| 2016 | $615 | $30,390 | $6,470 | $23,920 |
| 2015 | $615 | $30,390 | $6,470 | $23,920 |
| 2014 | $645 | $30,390 | $6,470 | $23,920 |
| 2013 | $687 | $30,390 | $6,470 | $23,920 |
Source: Public Records
Map
Nearby Homes
- 10429 Ohio 66
- 537 / 539 Toomey
- 629 N Main St
- 702 N Main St
- 409 N Bredeick St
- 709 W 4th St
- 610 N Washington St
- 704 N Franklin St
- 201 E 5th St
- 405 N Franklin St
- 708 W 1st St
- 221 S Main St
- 420 S Cass St
- 821 E 3rd St
- 424 S Canal St
- 483 S Franklin St
- 310 E Suthoff St
- 827 S Washington St
- 1000 Colettas Way
- 241 King St
Your Personal Tour Guide
Ask me questions while you tour the home.