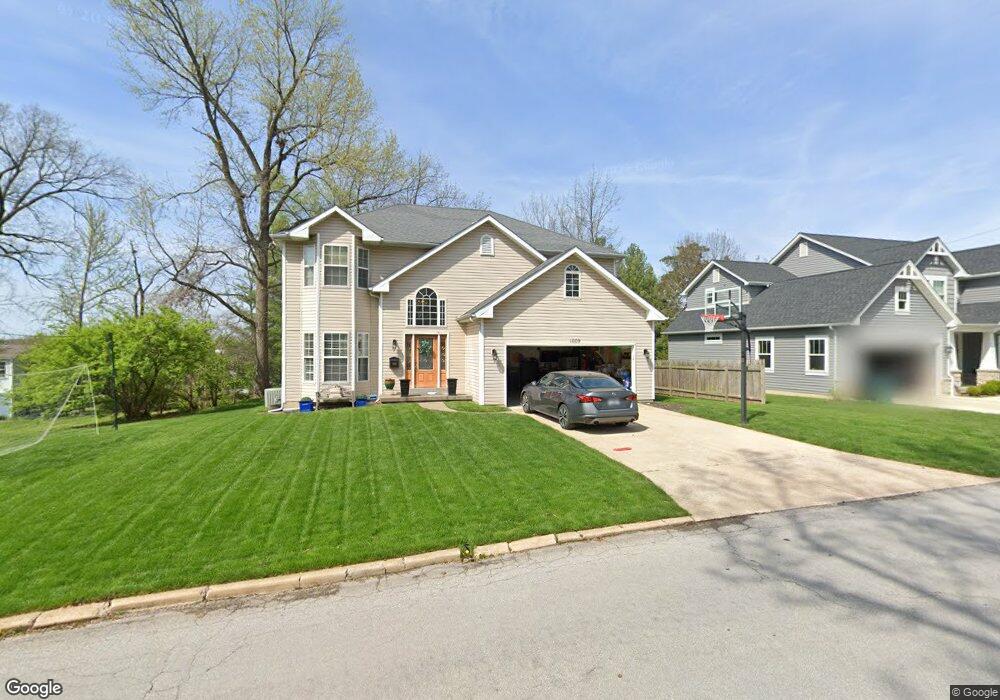
1009 Duley Ave Saint Louis, MO 63122
Estimated Value: $664,338 - $1,031,000
4
Beds
3
Baths
2,368
Sq Ft
$328/Sq Ft
Est. Value
About This Home
This home is located at 1009 Duley Ave, Saint Louis, MO 63122 and is currently estimated at $776,835, approximately $328 per square foot. 1009 Duley Ave is a home located in St. Louis County with nearby schools including George R. Robinson Elementary School, Nipher Middle School, and Kirkwood Senior High School.
Ownership History
Date
Name
Owned For
Owner Type
Purchase Details
Closed on
Feb 20, 2014
Sold by
Jacob Homes Inc
Bought by
Regagnon Stephanie and Regagnon Jason
Current Estimated Value
Home Financials for this Owner
Home Financials are based on the most recent Mortgage that was taken out on this home.
Original Mortgage
$362,900
Outstanding Balance
$273,188
Interest Rate
4.47%
Mortgage Type
New Conventional
Estimated Equity
$503,647
Purchase Details
Closed on
Feb 3, 2006
Sold by
B Harley Const Inc
Bought by
Jacob Homes Inc
Home Financials for this Owner
Home Financials are based on the most recent Mortgage that was taken out on this home.
Original Mortgage
$370,800
Interest Rate
6.18%
Mortgage Type
Construction
Purchase Details
Closed on
Feb 20, 2003
Sold by
Allen William H and Allen Margaret A
Bought by
B Harley Const Inc
Home Financials for this Owner
Home Financials are based on the most recent Mortgage that was taken out on this home.
Original Mortgage
$585,000
Interest Rate
5.93%
Create a Home Valuation Report for This Property
The Home Valuation Report is an in-depth analysis detailing your home's value as well as a comparison with similar homes in the area
Home Values in the Area
Average Home Value in this Area
Purchase History
| Date | Buyer | Sale Price | Title Company |
|---|---|---|---|
| Regagnon Stephanie | -- | -- | |
| Jacob Homes Inc | $145,000 | It | |
| B Harley Const Inc | -- | -- |
Source: Public Records
Mortgage History
| Date | Status | Borrower | Loan Amount |
|---|---|---|---|
| Open | Regagnon Stephanie | $362,900 | |
| Previous Owner | Jacob Homes Inc | $370,800 | |
| Previous Owner | B Harley Const Inc | $585,000 |
Source: Public Records
Tax History
| Year | Tax Paid | Tax Assessment Tax Assessment Total Assessment is a certain percentage of the fair market value that is determined by local assessors to be the total taxable value of land and additions on the property. | Land | Improvement |
|---|---|---|---|---|
| 2025 | $6,479 | $116,030 | $41,150 | $74,880 |
| 2024 | $6,479 | $103,650 | $29,640 | $74,010 |
| 2023 | $6,378 | $103,650 | $29,640 | $74,010 |
| 2022 | $6,023 | $91,310 | $29,640 | $61,670 |
| 2021 | $5,944 | $91,310 | $29,640 | $61,670 |
| 2020 | $5,662 | $83,620 | $25,690 | $57,930 |
| 2019 | $5,682 | $83,620 | $25,690 | $57,930 |
| 2018 | $5,680 | $73,830 | $19,760 | $54,070 |
| 2017 | $5,672 | $73,830 | $19,760 | $54,070 |
| 2016 | $4,872 | $63,860 | $16,450 | $47,410 |
| 2015 | $4,848 | $63,860 | $16,450 | $47,410 |
| 2014 | $5,617 | $72,450 | $7,980 | $64,470 |
Source: Public Records
Map
Nearby Homes
- 339 Caroline Ave
- 458 Crest Ave
- 621 Crest Ct
- 524 Hickory Hollow Ln
- 406 Meyer Ave
- 540 Hickory Hollow Ln
- 522 Nirk Ave Unit I
- 419 S Geyer Rd Unit 3
- 416 S Ballas Rd
- 425 S Geyer Rd Unit G
- 419 Gabriel Dr
- 1800 W Adams Ave
- 403 S Van Buren Ave
- 452 Iris Ln
- 558 S Geyer Rd
- 450 W Adams Ave Unit 18
- 523 W Washington Ave
- 441 Dickens Ave
- 506 Edna Ave
- 506 Coverdale Ln
Your Personal Tour Guide
Ask me questions while you tour the home.