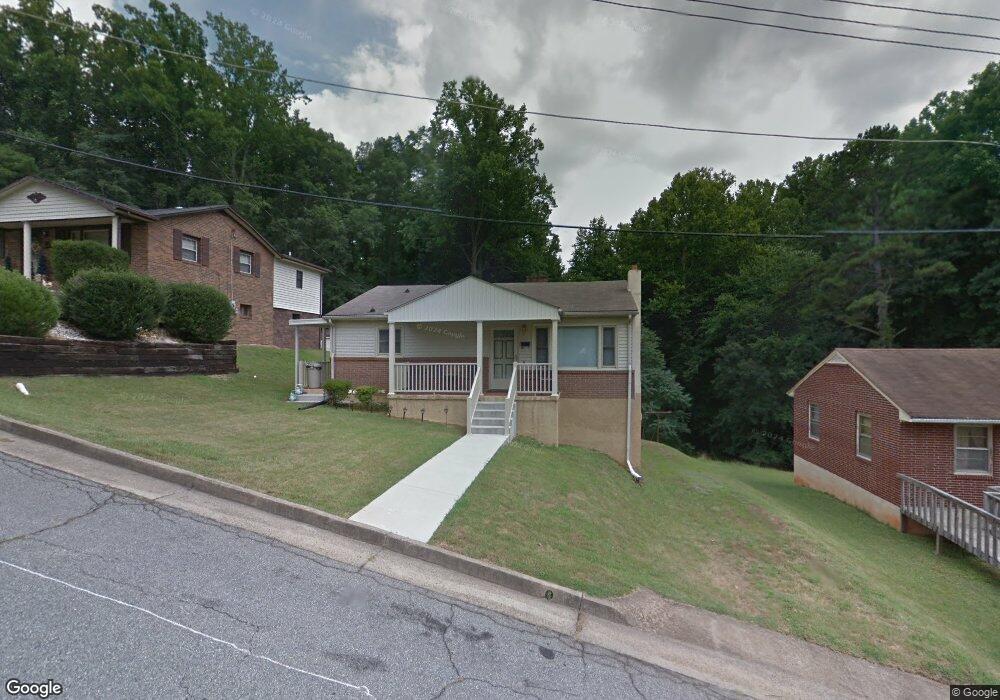
1009 F St Martinsville, VA 24112
Estimated Value: $48,000 - $101,000
--
Bed
--
Bath
952
Sq Ft
$76/Sq Ft
Est. Value
About This Home
This home is located at 1009 F St, Martinsville, VA 24112 and is currently estimated at $72,058, approximately $75 per square foot. 1009 F St is a home located in Martinsville City with nearby schools including Albert Harris Elementary School, Martinsville Middle School, and Martinsville High School.
Ownership History
Date
Name
Owned For
Owner Type
Purchase Details
Closed on
Aug 31, 2023
Sold by
Murdaugh Doris F
Bought by
Hairston James A and Hairston Linda M
Current Estimated Value
Home Financials for this Owner
Home Financials are based on the most recent Mortgage that was taken out on this home.
Original Mortgage
$35,280
Outstanding Balance
$34,472
Interest Rate
6.78%
Mortgage Type
Credit Line Revolving
Estimated Equity
$37,586
Create a Home Valuation Report for This Property
The Home Valuation Report is an in-depth analysis detailing your home's value as well as a comparison with similar homes in the area
Home Values in the Area
Average Home Value in this Area
Purchase History
| Date | Buyer | Sale Price | Title Company |
|---|---|---|---|
| Hairston James A | $44,100 | None Listed On Document |
Source: Public Records
Mortgage History
| Date | Status | Borrower | Loan Amount |
|---|---|---|---|
| Open | Hairston James A | $35,280 |
Source: Public Records
Tax History Compared to Growth
Tax History
| Year | Tax Paid | Tax Assessment Tax Assessment Total Assessment is a certain percentage of the fair market value that is determined by local assessors to be the total taxable value of land and additions on the property. | Land | Improvement |
|---|---|---|---|---|
| 2025 | $437 | $88,900 | $19,500 | $69,400 |
| 2024 | $437 | $44,100 | $3,000 | $41,100 |
| 2023 | $437 | $44,100 | $3,000 | $41,100 |
| 2022 | $335 | $32,200 | $3,000 | $29,200 |
| 2021 | $335 | $32,200 | $3,000 | $29,200 |
| 2020 | $341 | $32,100 | $3,000 | $29,100 |
| 2019 | $341 | $32,100 | $3,000 | $29,100 |
| 2018 | $367 | $32,000 | $3,000 | $29,000 |
| 2017 | $340 | $32,000 | $3,000 | $29,000 |
| 2016 | $394 | $37,100 | $6,000 | $31,100 |
| 2015 | $394 | $37,100 | $6,000 | $31,100 |
| 2014 | $395 | $37,200 | $6,000 | $31,200 |
Source: Public Records
Map
Nearby Homes