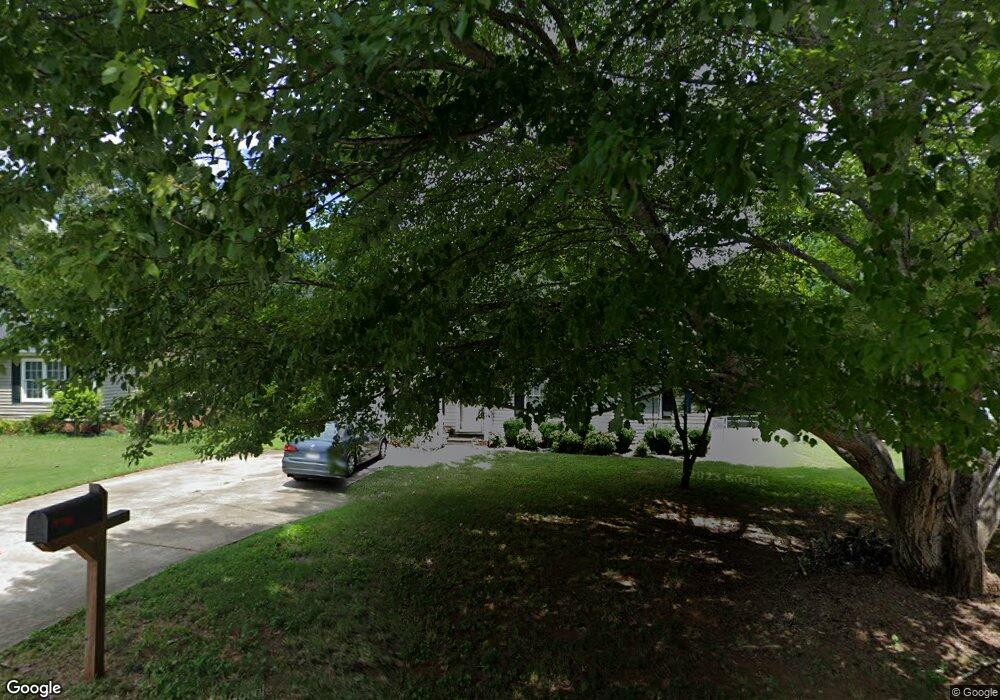
1009 Havelock Dr Taylors, SC 29687
Estimated Value: $186,000 - $257,000
3
Beds
2
Baths
1,288
Sq Ft
$183/Sq Ft
Est. Value
About This Home
This home is located at 1009 Havelock Dr, Taylors, SC 29687 and is currently estimated at $235,517, approximately $182 per square foot. 1009 Havelock Dr is a home located in Greenville County with nearby schools including Taylors Elementary School, Sevier Middle, and Wade Hampton High.
Ownership History
Date
Name
Owned For
Owner Type
Purchase Details
Closed on
Jun 25, 2024
Sold by
Leuschel Judith Mae
Bought by
Leuschel Jonathan Elliot
Current Estimated Value
Purchase Details
Closed on
Jul 6, 2015
Sold by
Estate Of Richard Kenneth Leuschel and Leuschel Judith May
Bought by
Leuschel Judith M
Purchase Details
Closed on
Dec 18, 2014
Sold by
The Estate Of Richard K Leuschel and Leuschel Judith May
Bought by
Leuschel Judith M
Purchase Details
Closed on
May 23, 2006
Sold by
Leuschel Jonathan E and Leuschel Richard K
Bought by
Southern Cornerstone Properties Llc
Purchase Details
Closed on
Jul 26, 2002
Sold by
Letellier Monica
Bought by
Leuschel Jonathan E
Purchase Details
Closed on
Jun 20, 2001
Sold by
Letellier Shawn William
Bought by
Letellier Monica
Purchase Details
Closed on
May 24, 1999
Sold by
Sumner Charles S
Bought by
Letellier Shawn W
Create a Home Valuation Report for This Property
The Home Valuation Report is an in-depth analysis detailing your home's value as well as a comparison with similar homes in the area
Home Values in the Area
Average Home Value in this Area
Purchase History
| Date | Buyer | Sale Price | Title Company |
|---|---|---|---|
| Leuschel Jonathan Elliot | -- | None Listed On Document | |
| Leuschel Judith M | -- | -- | |
| Leuschel Judith M | -- | -- | |
| Southern Cornerstone Properties Llc | $77,000 | None Available | |
| Leuschel Jonathan E | $77,000 | -- | |
| Letellier Monica | -- | -- | |
| Letellier Shawn W | $90,000 | -- |
Source: Public Records
Tax History Compared to Growth
Tax History
| Year | Tax Paid | Tax Assessment Tax Assessment Total Assessment is a certain percentage of the fair market value that is determined by local assessors to be the total taxable value of land and additions on the property. | Land | Improvement |
|---|---|---|---|---|
| 2024 | $2,366 | $6,210 | $1,280 | $4,930 |
| 2023 | $2,276 | $6,210 | $1,280 | $4,930 |
| 2022 | $2,117 | $6,210 | $1,280 | $4,930 |
| 2021 | $2,272 | $6,210 | $1,280 | $4,930 |
| 2020 | $2,103 | $5,400 | $1,110 | $4,290 |
| 2019 | $2,089 | $5,400 | $1,110 | $4,290 |
| 2018 | $2,038 | $5,400 | $1,110 | $4,290 |
| 2017 | $1,995 | $5,400 | $1,110 | $4,290 |
| 2016 | $1,931 | $89,930 | $18,500 | $71,430 |
| 2015 | $1,835 | $89,930 | $18,500 | $71,430 |
| 2014 | $1,698 | $84,990 | $18,500 | $66,490 |
Source: Public Records
Map
Nearby Homes
- 10 Velma Dr
- 812 Reid School Rd Unit 72
- 812 Reid School Rd Unit 6
- 22 Aetna Springs Ct
- 19 Velma Dr
- 4 Aetna Spring Ct
- 25 Goodwin Dr
- 424 Blissful Ct
- 420 Blissful Ct
- 431 Blissful Ct
- 429 Blissful Ct
- 427 Blissful Ct
- 412 Blissful Ct
- 410 Blissful Ct
- 408 Blissful Ct
- 107 Pleasure Ln
- 108 Pleasure Ln
- 105 Pleasure Ln
- 1007 Havelock Dr
- 1011 Havelock Dr
- 1410 Winding Way
- 1005 Havelock Dr
- 1408 Winding Way
- 1500 Winding Way
- 1406 Winding Way
- 1008 Havelock Dr
- 1010 Havelock Dr
- 1502 Winding Way
- 1006 Havelock Dr
- 1003 Havelock Dr
- 1015 Havelock Dr
- 1404 Winding Way
- 1012 Havelock Dr
- 1004 Havelock Dr
- 1504 Winding Way
- 1402 Winding Way
- 1017 Havelock Dr
- 1014 Havelock Dr