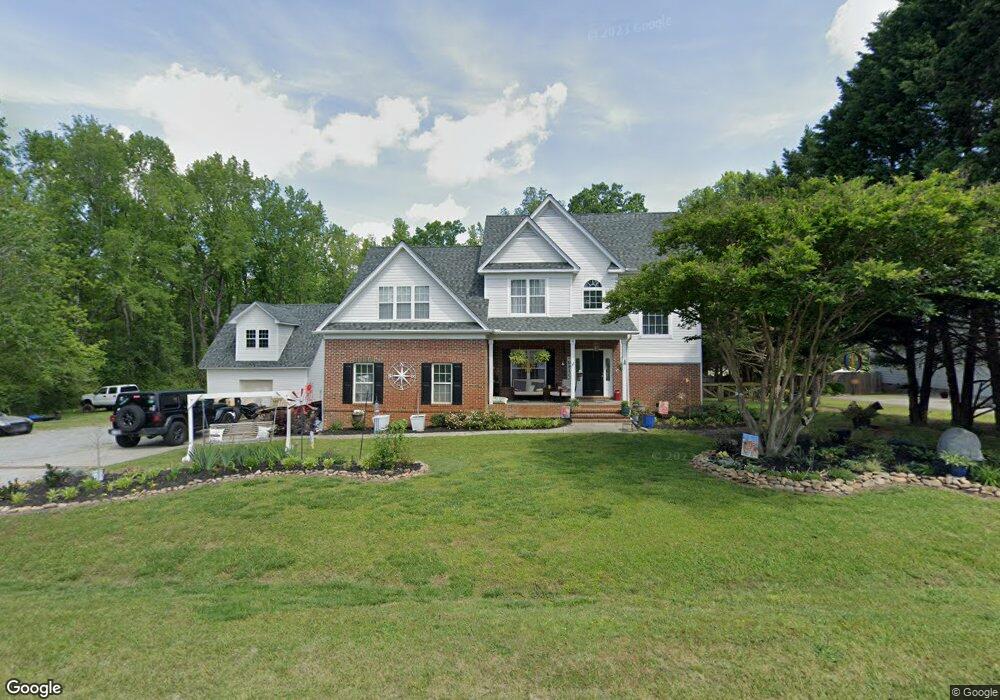
1009 Hazelton Ln Fuquay Varina, NC 27526
Estimated Value: $495,000 - $519,699
3
Beds
3
Baths
2,414
Sq Ft
$211/Sq Ft
Est. Value
About This Home
This home is located at 1009 Hazelton Ln, Fuquay Varina, NC 27526 and is currently estimated at $508,675, approximately $210 per square foot. 1009 Hazelton Ln is a home located in Wake County with nearby schools including Carolina Charter Academy.
Ownership History
Date
Name
Owned For
Owner Type
Purchase Details
Closed on
Oct 14, 2016
Sold by
Evans Richard D and Evans Sarah
Bought by
Mcdonald Andrew J and Mcdonald Sharina
Current Estimated Value
Home Financials for this Owner
Home Financials are based on the most recent Mortgage that was taken out on this home.
Original Mortgage
$248,417
Outstanding Balance
$198,582
Interest Rate
3.37%
Mortgage Type
FHA
Estimated Equity
$310,093
Purchase Details
Closed on
Jun 9, 2006
Sold by
Fuller Lance and Fuller Mary Lou A
Bought by
Evans Richard D and Evans Sarah
Home Financials for this Owner
Home Financials are based on the most recent Mortgage that was taken out on this home.
Original Mortgage
$192,000
Interest Rate
6.5%
Mortgage Type
Purchase Money Mortgage
Purchase Details
Closed on
Feb 6, 2001
Sold by
Jones Building & Dev Co Inc
Bought by
Fuller Lance and Fuller Mary Lou A
Purchase Details
Closed on
Dec 21, 1999
Sold by
Kantola Eric
Bought by
Jones Building & Development Company Inc
Create a Home Valuation Report for This Property
The Home Valuation Report is an in-depth analysis detailing your home's value as well as a comparison with similar homes in the area
Home Values in the Area
Average Home Value in this Area
Purchase History
| Date | Buyer | Sale Price | Title Company |
|---|---|---|---|
| Mcdonald Andrew J | $253,000 | None Available | |
| Evans Richard D | $240,000 | None Available | |
| Fuller Lance | $31,500 | -- | |
| Jones Building & Development Company Inc | $31,000 | -- |
Source: Public Records
Mortgage History
| Date | Status | Borrower | Loan Amount |
|---|---|---|---|
| Open | Mcdonald Andrew J | $248,417 | |
| Previous Owner | Evans Richard D | $192,000 |
Source: Public Records
Tax History Compared to Growth
Tax History
| Year | Tax Paid | Tax Assessment Tax Assessment Total Assessment is a certain percentage of the fair market value that is determined by local assessors to be the total taxable value of land and additions on the property. | Land | Improvement |
|---|---|---|---|---|
| 2025 | $3,213 | $499,274 | $100,000 | $399,274 |
| 2024 | $3,120 | $499,274 | $100,000 | $399,274 |
| 2023 | $2,617 | $333,019 | $46,000 | $287,019 |
| 2022 | $2,425 | $333,019 | $46,000 | $287,019 |
| 2021 | $2,360 | $333,019 | $46,000 | $287,019 |
| 2020 | $2,321 | $333,019 | $46,000 | $287,019 |
| 2019 | $1,990 | $241,211 | $34,000 | $207,211 |
| 2018 | $1,830 | $223,151 | $34,000 | $189,151 |
| 2017 | $1,607 | $223,151 | $34,000 | $189,151 |
| 2016 | $1,574 | $223,151 | $34,000 | $189,151 |
| 2015 | $1,734 | $246,857 | $41,400 | $205,457 |
| 2014 | $1,644 | $246,857 | $41,400 | $205,457 |
Source: Public Records
Map
Nearby Homes
- 2709 Banks Lake Ct
- 420 Apalachia Lake Dr
- 637 Lake Artesia Ln
- 2405 Heathland Farm Dr
- 521 Lake Gaston Dr
- 639 Ashe Lake Way
- 719 Shoals Lake Dr
- 2933 Lake James Dr
- 3408 Apple Meadow Dr
- 2942 Wilkes Lake Dr
- 858 Lake Artesia Ln
- 3409 Bennyfield Ct
- 515 Glenville Lake Dr
- 3301 Cobham Ct
- 112 Wilbur Lake Dr
- 2716 Rindlewood Ct
- 1643 Southcross St
- 101 Boone Lake Way
- 8212 White Star Dr
- 1757 Whitbrook Ct
- 1009 Hazelton Woods Ln
- 1005 Hazelton Ln
- 1001 Hazelton Ln
- 1004 Hazelton Ln
- 1013 Hazelton Ln
- 1008 Hazelton Ln
- 1000 Hazelton Ln
- 1012 Hazelton Ln
- 1017 Hazelton Ln
- 1016 Hazelton Woods Dr
- 0 Hazelton Ln
- lt 9 Hazelton Ln
- 1016 Hazelton Ln
- 6832 S Nc 55 Hwy
- 529 Highrock Lake Rd
- 533 Highrock Lake Rd
- 1137 Durbin Way
- 2687 Jenkins Lake Ct
- 2687 Jenkins Lake Ct Unit 238
- 525 Highrock Lake Rd