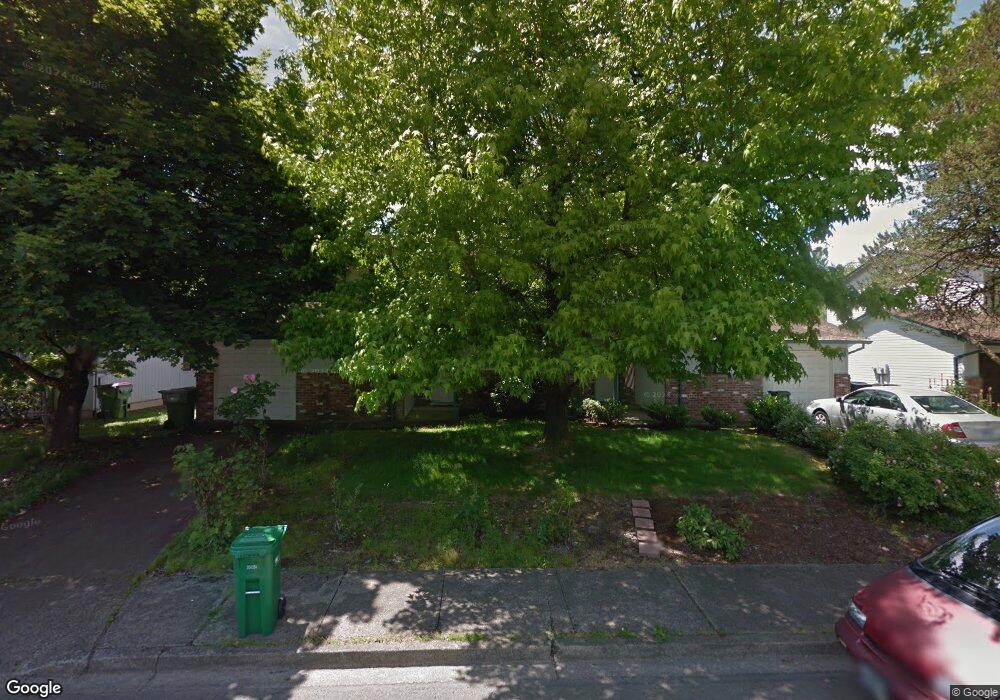
1009 James St Newberg, OR 97132
Estimated Value: $573,414 - $598,000
4
Beds
4
Baths
2,346
Sq Ft
$249/Sq Ft
Est. Value
About This Home
This home is located at 1009 James St, Newberg, OR 97132 and is currently estimated at $583,604, approximately $248 per square foot. 1009 James St is a home located in Yamhill County with nearby schools including Edwards Elementary School, Chehalem Valley Middle School, and Newberg Senior High School.
Ownership History
Date
Name
Owned For
Owner Type
Purchase Details
Closed on
Dec 17, 2018
Sold by
Colling Charles W
Bought by
Colling Newberg Properties Llc
Current Estimated Value
Purchase Details
Closed on
Jul 30, 2009
Sold by
Nelson David A and Nelson Patricia K
Bought by
Colling Charles W
Home Financials for this Owner
Home Financials are based on the most recent Mortgage that was taken out on this home.
Original Mortgage
$200,000
Outstanding Balance
$129,999
Interest Rate
5.31%
Mortgage Type
Seller Take Back
Estimated Equity
$453,605
Purchase Details
Closed on
Sep 10, 2008
Sold by
Nelson David A
Bought by
Nelson David A and Nelson Patricia K
Purchase Details
Closed on
Aug 22, 2007
Sold by
Colling Joyce Colleen
Bought by
Nelson David A
Purchase Details
Closed on
Dec 29, 2006
Sold by
Colling Joyce Colleen
Bought by
Colling Joyce Colleen and The Arthur H Nelson Credit Shelter Trust
Create a Home Valuation Report for This Property
The Home Valuation Report is an in-depth analysis detailing your home's value as well as a comparison with similar homes in the area
Purchase History
| Date | Buyer | Sale Price | Title Company |
|---|---|---|---|
| Colling Newberg Properties Llc | -- | Accommodation | |
| Colling Charles W | $235,000 | Ticor Title Insurance Co | |
| Nelson David A | -- | None Available | |
| Nelson David A | -- | None Available | |
| Colling Joyce Colleen | -- | None Available |
Source: Public Records
Mortgage History
| Date | Status | Borrower | Loan Amount |
|---|---|---|---|
| Open | Colling Charles W | $200,000 |
Source: Public Records
Tax History
| Year | Tax Paid | Tax Assessment Tax Assessment Total Assessment is a certain percentage of the fair market value that is determined by local assessors to be the total taxable value of land and additions on the property. | Land | Improvement |
|---|---|---|---|---|
| 2025 | $4,422 | $274,011 | -- | -- |
| 2024 | $4,252 | $266,030 | -- | -- |
| 2023 | $4,107 | $258,282 | $0 | $0 |
| 2022 | $3,996 | $250,759 | $0 | $0 |
| 2021 | $3,888 | $243,455 | $0 | $0 |
| 2020 | $3,501 | $236,364 | $0 | $0 |
| 2019 | $3,454 | $229,480 | $0 | $0 |
| 2018 | $3,473 | $222,796 | $0 | $0 |
| 2017 | $3,692 | $216,307 | $0 | $0 |
| 2016 | $3,616 | $210,007 | $0 | $0 |
| 2015 | $3,551 | $203,892 | $0 | $0 |
| 2014 | $3,313 | $197,955 | $0 | $0 |
Source: Public Records
Map
Nearby Homes
- 504 E 9th 13 St
- 504 E 9th 14 St
- 1113 James St
- 903 Charles St
- 810 E 9th St Unit D13
- 810 E 9th St Unit B8
- 810 E 9th St Unit B5
- 1487 S Gia Ct
- 100 W Johanna Ct
- 1636 S Mike Dr
- 1207 E 11th St
- 429 S Main St
- 401 S College St
- 712 S Willamette St
- 1212 E 6th St
- 822 S Columbia St
- 1404 E 8th St
- 1824 NE Waterfront St
- 108 S Howard St
- 24300 NE Dayton Ave
Your Personal Tour Guide
Ask me questions while you tour the home.