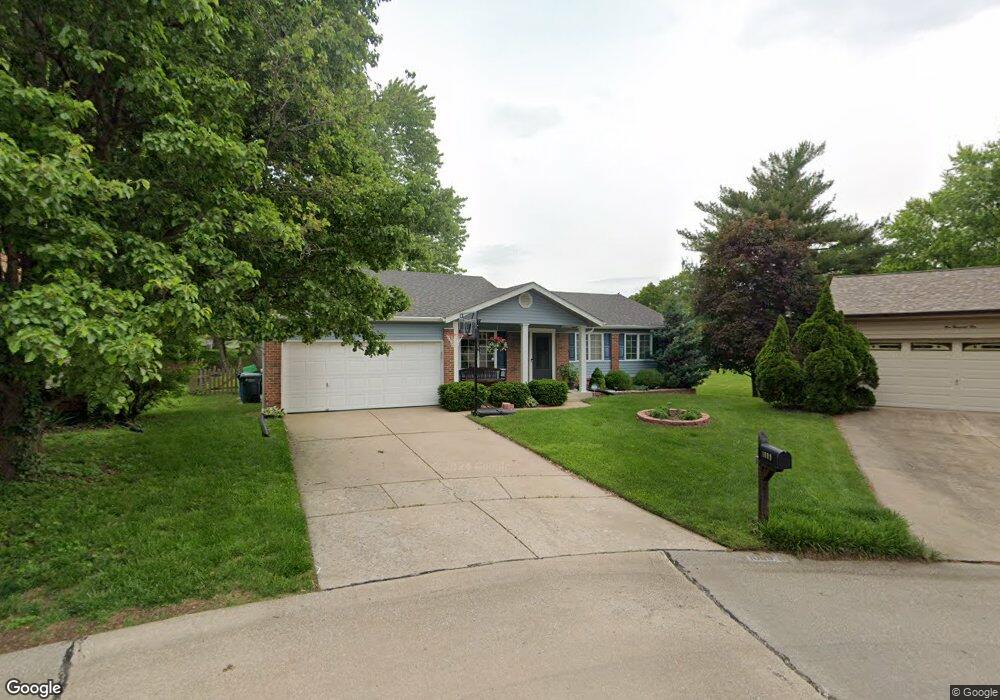
1009 Lanawood Ct Florissant, MO 63031
Estimated Value: $229,994 - $264,000
3
Beds
2
Baths
1,283
Sq Ft
$195/Sq Ft
Est. Value
About This Home
This home is located at 1009 Lanawood Ct, Florissant, MO 63031 and is currently estimated at $250,749, approximately $195 per square foot. 1009 Lanawood Ct is a home located in St. Louis County with nearby schools including Russell Elementary School, West Middle School, and Hazelwood West High School.
Ownership History
Date
Name
Owned For
Owner Type
Purchase Details
Closed on
Sep 25, 2012
Sold by
Federal Home Loan Mortgage Corporation
Bought by
Chau Jenny
Current Estimated Value
Home Financials for this Owner
Home Financials are based on the most recent Mortgage that was taken out on this home.
Original Mortgage
$66,600
Interest Rate
2.66%
Mortgage Type
New Conventional
Purchase Details
Closed on
May 9, 2012
Sold by
Kidwai Ather M and Kidwai Elvie A
Bought by
Federal Home Loan Mortgage Corporation
Purchase Details
Closed on
Sep 22, 2005
Sold by
Lay Zachary
Bought by
Didwai Ather M and Kidwai Elvie A
Home Financials for this Owner
Home Financials are based on the most recent Mortgage that was taken out on this home.
Original Mortgage
$32,980
Interest Rate
5.76%
Mortgage Type
Credit Line Revolving
Purchase Details
Closed on
May 12, 2005
Sold by
Lay Kristine M
Bought by
Lay Zachary D
Purchase Details
Closed on
Apr 28, 2000
Sold by
Mjr Rakonick John and Mjr Ann E
Bought by
Lay Zachary D and Lay Kristine M
Home Financials for this Owner
Home Financials are based on the most recent Mortgage that was taken out on this home.
Original Mortgage
$100,800
Interest Rate
7.75%
Create a Home Valuation Report for This Property
The Home Valuation Report is an in-depth analysis detailing your home's value as well as a comparison with similar homes in the area
Home Values in the Area
Average Home Value in this Area
Purchase History
| Date | Buyer | Sale Price | Title Company |
|---|---|---|---|
| Chau Jenny | $111,000 | Insight Title | |
| Federal Home Loan Mortgage Corporation | $115,000 | None Available | |
| Didwai Ather M | $164,900 | -- | |
| Lay Zachary D | -- | -- | |
| Lay Zachary D | $126,000 | -- |
Source: Public Records
Mortgage History
| Date | Status | Borrower | Loan Amount |
|---|---|---|---|
| Previous Owner | Chau Jenny | $66,600 | |
| Previous Owner | Didwai Ather M | $32,980 | |
| Previous Owner | Didwai Ather M | $131,920 | |
| Previous Owner | Lay Zachary D | $100,800 |
Source: Public Records
Tax History Compared to Growth
Tax History
| Year | Tax Paid | Tax Assessment Tax Assessment Total Assessment is a certain percentage of the fair market value that is determined by local assessors to be the total taxable value of land and additions on the property. | Land | Improvement |
|---|---|---|---|---|
| 2025 | $2,911 | $39,940 | $9,650 | $30,290 |
| 2024 | $2,911 | $35,760 | $3,880 | $31,880 |
| 2023 | $2,949 | $35,760 | $3,880 | $31,880 |
| 2022 | $2,643 | $28,610 | $6,250 | $22,360 |
| 2021 | $2,598 | $28,610 | $6,250 | $22,360 |
| 2020 | $2,508 | $25,840 | $5,360 | $20,480 |
| 2019 | $2,451 | $25,840 | $5,360 | $20,480 |
| 2018 | $2,274 | $22,210 | $5,360 | $16,850 |
| 2017 | $2,261 | $22,210 | $5,360 | $16,850 |
| 2016 | $2,151 | $20,940 | $4,660 | $16,280 |
| 2015 | $2,101 | $20,940 | $4,660 | $16,280 |
| 2014 | $2,275 | $22,580 | $5,420 | $17,160 |
Source: Public Records
Map
Nearby Homes
- 1035 Rosary Tree Ct
- 1090 Howdershell Rd
- 154 Riverwood Park Dr
- 1978 Acorn Trail Dr
- 1565 Yaqui Dr
- 1815 Flordawn Dr
- 5 Seminary Ct
- 1495 Yaqui Dr
- 7250 Howdershell Rd
- 7240 Howdershell Rd
- 1085 Campion Ln
- 805 Coach Light Ln
- 7565 English Coach Ln
- 7525 English Coach Ln
- 1160 Kostka Ln
- 753 Coach Light Ln
- 2 Taylor Trail Place
- 912 Shamrock Dr
- 10 Garnier Ct
- 400 Raymond Dr
- 1015 Lanawood Ct
- 1004 Lanawood Ct
- 1008 Willow River Ct
- 1021 Lanawood Ct
- 1010 Lanawood Ct
- 1020 Willow River Ct
- 1002 Willow River Ct
- 1016 Lanawood Ct
- 1022 Lanawood Ct
- 1027 Lanawood Ct
- 1037 Timberwood Trails Dr
- 1007 Willow River Ct
- 1043 Timberwood Trails Dr
- 1026 Willow River Ct
- 1013 Willow River Ct
- 1049 Timberwood Trails Dr
- 1025 Timberwood Trails Dr
- 2049 Riverwood Trails Dr
- 1031 Timberwood Trails Dr
- 1028 Lanawood Ct