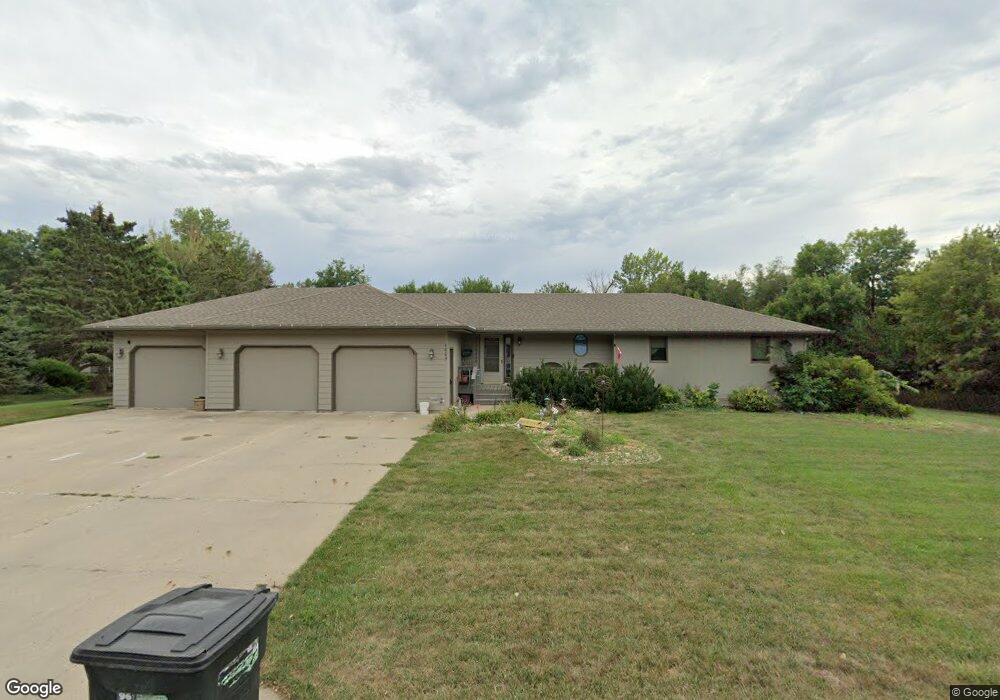
1009 Locust St Beresford, SD 57004
Estimated Value: $333,000 - $406,000
3
Beds
--
Bath
1,416
Sq Ft
$260/Sq Ft
Est. Value
About This Home
This home is located at 1009 Locust St, Beresford, SD 57004 and is currently estimated at $368,217, approximately $260 per square foot. 1009 Locust St is a home with nearby schools including Beresford Elementary School, Beresford Middle School, and Beresford High School.
Ownership History
Date
Name
Owned For
Owner Type
Purchase Details
Closed on
May 30, 2018
Sold by
Olson Jeff and Olson Heidi
Bought by
Olson Jessica L and Storo Matthew G
Current Estimated Value
Home Financials for this Owner
Home Financials are based on the most recent Mortgage that was taken out on this home.
Original Mortgage
$171,500
Outstanding Balance
$147,667
Interest Rate
4.4%
Mortgage Type
New Conventional
Estimated Equity
$220,550
Purchase Details
Closed on
Sep 23, 2015
Sold by
Olson Larry and Olson Jennifer
Bought by
Olson Jeffrey and Olson Heidi
Home Financials for this Owner
Home Financials are based on the most recent Mortgage that was taken out on this home.
Original Mortgage
$209,000
Interest Rate
3.91%
Mortgage Type
New Conventional
Purchase Details
Closed on
Oct 10, 2011
Sold by
Olson Larry F
Bought by
Olson Jeff
Home Financials for this Owner
Home Financials are based on the most recent Mortgage that was taken out on this home.
Original Mortgage
$100,000
Interest Rate
4.22%
Mortgage Type
New Conventional
Create a Home Valuation Report for This Property
The Home Valuation Report is an in-depth analysis detailing your home's value as well as a comparison with similar homes in the area
Purchase History
| Date | Buyer | Sale Price | Title Company |
|---|---|---|---|
| Olson Jessica L | $220,000 | None Available | |
| Olson Jeffrey | $209,000 | None Available | |
| Olson Jeff | $47,000 | None Available |
Source: Public Records
Mortgage History
| Date | Status | Borrower | Loan Amount |
|---|---|---|---|
| Open | Olson Jessica L | $171,500 | |
| Previous Owner | Olson Jeffrey | $209,000 | |
| Previous Owner | Olson Jeff | $100,000 |
Source: Public Records
Tax History
| Year | Tax Paid | Tax Assessment Tax Assessment Total Assessment is a certain percentage of the fair market value that is determined by local assessors to be the total taxable value of land and additions on the property. | Land | Improvement |
|---|---|---|---|---|
| 2025 | $4,548 | $328,059 | $25,532 | $302,527 |
| 2024 | $4,548 | $328,059 | $25,532 | $302,527 |
| 2023 | $3,736 | $300,566 | $25,532 | $275,034 |
| 2022 | $3,332 | $231,270 | $19,682 | $211,588 |
| 2021 | $3,259 | $201,118 | $17,115 | $184,003 |
| 2020 | $3,244 | $192,361 | $17,115 | $175,246 |
| 2019 | $2,262 | $192,361 | $17,115 | $175,246 |
| 2018 | $2,267 | $109,065 | $17,115 | $91,950 |
| 2017 | $1,670 | $109,065 | $17,115 | $91,950 |
| 2016 | $1,754 | $99,150 | $0 | $99,150 |
| 2015 | $1,754 | $99,150 | $0 | $99,150 |
| 2014 | $1,733 | $99,150 | $0 | $99,150 |
| 2013 | $1,715 | $99,150 | $0 | $99,150 |
| 2012 | $1,715 | $99,150 | $15,559 | $83,591 |
Source: Public Records
Map
Nearby Homes
- 1130 Sunset Dr
- 1140 Sunset Dr
- 411 S 6th St
- 511 W Main St
- 0 4th St Unit 22601426
- 0 4th St Unit 22601427
- 500 W Spruce St
- 505 W Cedar St
- 411 W Cedar St
- 600 S 3rd St
- 206 W Hemlock St
- 208 S 3rd St
- 200 S 3rd St
- 201 W Willow St
- 309 S 1st St
- 507 1st St N St
- 405 SE 13th St
- 46967 S Dakota 46
- i-29 470th Ave
- 46924 298th St
- 1007 Locust St
- 1006 Locust St
- 1008 Locust St
- 703 SW 13th St
- 1010 Locust St
- 701 SW 13th St
- 609 SW 13th St
- 507 SW 13th St
- 901 SW 13th St
- 1005 Cottonwood St
- 505 SW 13th St
- 501 SW 13th St
- 0 SW 13th St Unit 21802925
- 504 SW 13th St
- 805 SW 13th St
- 910 Augusta Dr
- 502 SW 13th St
- 502 S 13th St
- 422 Sunset Dr
- 1008 Walnut St
Your Personal Tour Guide
Ask me questions while you tour the home.