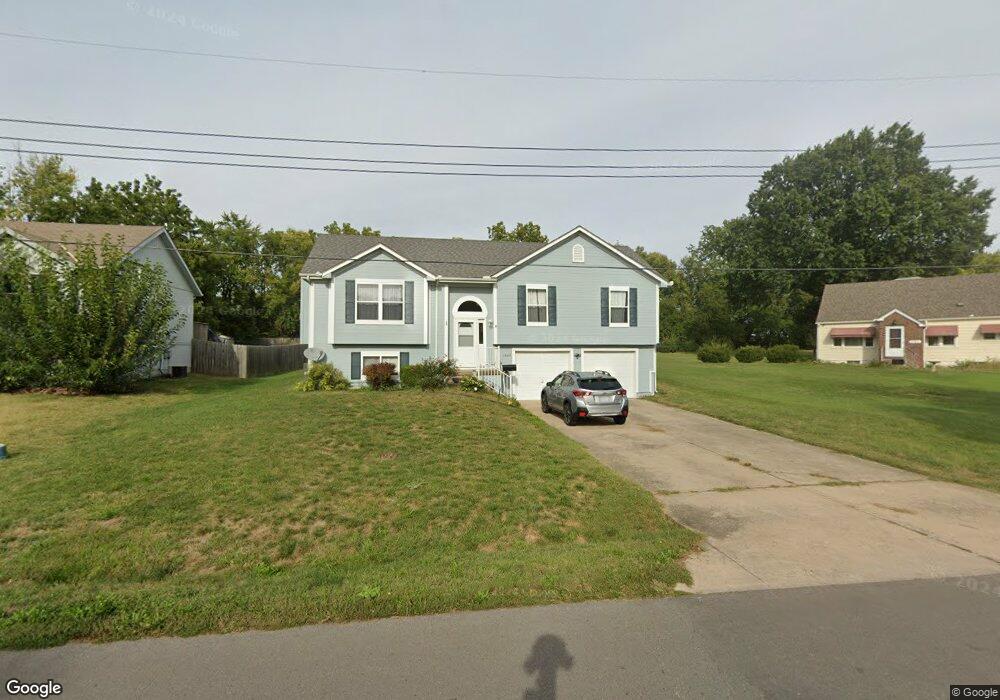
1009 Main St Belton, MO 64012
Estimated Value: $275,210 - $349,000
3
Beds
3
Baths
1,254
Sq Ft
$251/Sq Ft
Est. Value
About This Home
This home is located at 1009 Main St, Belton, MO 64012 and is currently estimated at $315,053, approximately $251 per square foot. 1009 Main St is a home located in Cass County with nearby schools including Scott Elementary School, Belton Middle School, and Mill Creek Upper Elementary School.
Ownership History
Date
Name
Owned For
Owner Type
Purchase Details
Closed on
Dec 17, 2012
Sold by
Fritts Kenneth E and Fritts Margaret E
Bought by
Fritts Kenneth E and Fritts Margaret E
Current Estimated Value
Purchase Details
Closed on
Mar 15, 2010
Sold by
Fritts Kenneth E and Fritts Margaret E
Bought by
Fritts Kenneth E and Fritts Margaret E
Home Financials for this Owner
Home Financials are based on the most recent Mortgage that was taken out on this home.
Original Mortgage
$144,201
Interest Rate
4.93%
Mortgage Type
FHA
Purchase Details
Closed on
Sep 10, 2009
Sold by
Morlang Vernon L and Morlang Roberta D
Bought by
Fritts Kenneth E and Fritts Margaret E
Create a Home Valuation Report for This Property
The Home Valuation Report is an in-depth analysis detailing your home's value as well as a comparison with similar homes in the area
Home Values in the Area
Average Home Value in this Area
Purchase History
| Date | Buyer | Sale Price | Title Company |
|---|---|---|---|
| Fritts Kenneth E | -- | None Available | |
| Fritts Kenneth E | -- | None Available | |
| Fritts Kenneth E | -- | -- | |
| Fritts Kenneth E | -- | None Available |
Source: Public Records
Mortgage History
| Date | Status | Borrower | Loan Amount |
|---|---|---|---|
| Previous Owner | Fritts Kenneth E | $144,201 |
Source: Public Records
Tax History
| Year | Tax Paid | Tax Assessment Tax Assessment Total Assessment is a certain percentage of the fair market value that is determined by local assessors to be the total taxable value of land and additions on the property. | Land | Improvement |
|---|---|---|---|---|
| 2025 | $2,642 | $36,360 | $2,510 | $33,850 |
| 2024 | $2,642 | $32,040 | $1,890 | $30,150 |
| 2023 | $2,648 | $32,200 | $2,050 | $30,150 |
| 2022 | $2,332 | $28,110 | $2,050 | $26,060 |
| 2021 | $2,332 | $28,110 | $2,050 | $26,060 |
| 2020 | $2,275 | $27,260 | $2,050 | $25,210 |
| 2019 | $2,228 | $27,260 | $2,050 | $25,210 |
| 2018 | $1,989 | $24,540 | $1,640 | $22,900 |
| 2017 | $1,889 | $24,540 | $1,640 | $22,900 |
| 2016 | $1,889 | $23,170 | $1,640 | $21,530 |
| 2015 | $1,888 | $23,170 | $1,640 | $21,530 |
| 2014 | $1,895 | $23,170 | $1,640 | $21,530 |
| 2013 | -- | $23,170 | $1,640 | $21,530 |
Source: Public Records
Map
Nearby Homes
- 513 S Cedar St
- 705 Poplar Cir
- 206-216 E South Ave
- 806 Winesap Cir
- 808 Golden Ct
- 602 S Cedar St
- 507 3 St
- 709 Hollis Ave
- 703 York Dr
- 709 Shane Ln
- 715 Shane Ln
- 701 Solstice Cir
- 606 Fallen Leaf Dr
- 609 Fallen Leaf Dr
- 718 Fallen Leaf Dr
- 718 Solstice Cir
- 710 Fallen Leaf Dr
- 706 Fallen Leaf Dr
- 713 Fallen Leaf Dr
- 717 Fallen Leaf Dr
Your Personal Tour Guide
Ask me questions while you tour the home.