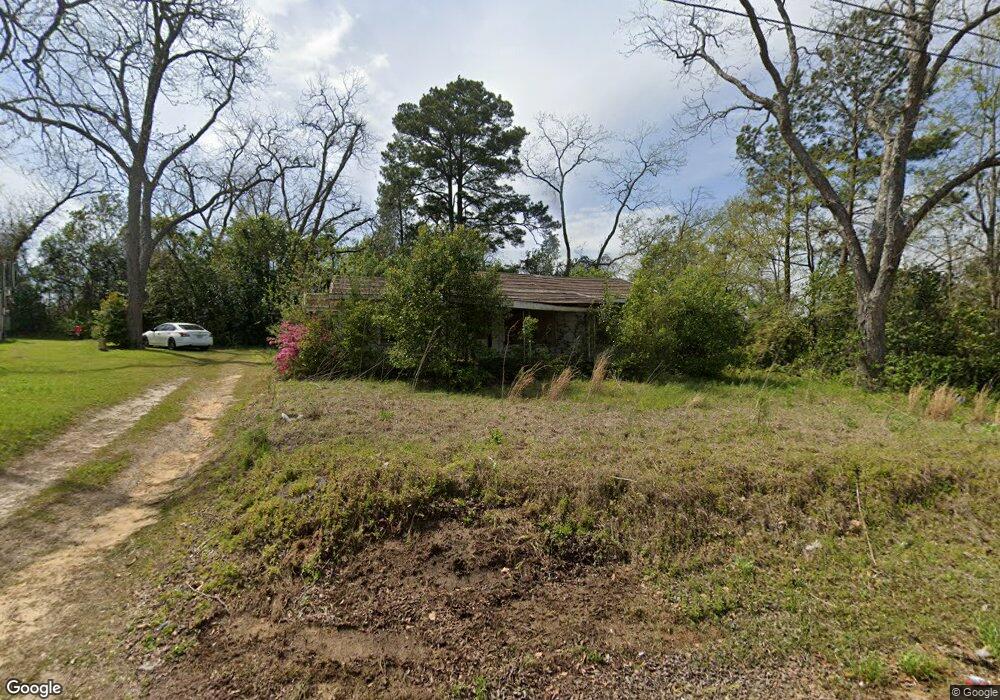
1009 N 6th St Cordele, GA 31015
Estimated Value: $44,000 - $93,000
3
Beds
1
Bath
1,127
Sq Ft
$64/Sq Ft
Est. Value
About This Home
This home is located at 1009 N 6th St, Cordele, GA 31015 and is currently estimated at $71,971, approximately $63 per square foot. 1009 N 6th St is a home located in Crisp County with nearby schools including Crisp County Elementary School, Crisp County Primary School, and Crisp County Middle School.
Ownership History
Date
Name
Owned For
Owner Type
Purchase Details
Closed on
Jan 23, 2012
Sold by
Plantersfirst
Bought by
Penney Carlan Travis
Current Estimated Value
Purchase Details
Closed on
May 3, 2011
Sold by
Beatty T Craig
Bought by
Plantersfirst
Purchase Details
Closed on
Jan 1, 2008
Sold by
Beatty T Craig
Bought by
Beatty T Craig
Purchase Details
Closed on
Aug 15, 2003
Sold by
Beatty Terry C and Beatty Robert F
Bought by
Beatty T Craig
Purchase Details
Closed on
Nov 13, 2002
Sold by
Blizzard Thelma
Bought by
Beatty Terry C and Beatty Robert F
Purchase Details
Closed on
May 10, 2001
Sold by
Blizzard Robert Eta
Bought by
Blizzard Thelma
Purchase Details
Closed on
Oct 14, 1980
Bought by
Blizzard Robert Eta
Purchase Details
Closed on
Nov 18, 1977
Bought by
Hewitt Coleman Etal
Create a Home Valuation Report for This Property
The Home Valuation Report is an in-depth analysis detailing your home's value as well as a comparison with similar homes in the area
Home Values in the Area
Average Home Value in this Area
Purchase History
| Date | Buyer | Sale Price | Title Company |
|---|---|---|---|
| Penney Carlan Travis | $20,000 | -- | |
| Penney Carlan Travis | $20,000 | -- | |
| Plantersfirst | -- | -- | |
| Beatty T Craig | $50,000 | -- | |
| Beatty T Craig | $21,000 | -- | |
| Beatty Terry C | $57,000 | -- | |
| Blizzard Thelma | -- | -- | |
| Blizzard Robert Eta | $20,500 | -- | |
| Hewitt Coleman Etal | -- | -- |
Source: Public Records
Tax History Compared to Growth
Tax History
| Year | Tax Paid | Tax Assessment Tax Assessment Total Assessment is a certain percentage of the fair market value that is determined by local assessors to be the total taxable value of land and additions on the property. | Land | Improvement |
|---|---|---|---|---|
| 2025 | $96 | $2,667 | $1,667 | $1,000 |
| 2024 | $96 | $2,667 | $1,667 | $1,000 |
| 2023 | $100 | $2,667 | $1,667 | $1,000 |
| 2022 | $71 | $2,667 | $1,667 | $1,000 |
| 2021 | $69 | $2,667 | $1,667 | $1,000 |
| 2020 | $75 | $2,667 | $1,667 | $1,000 |
| 2019 | $76 | $2,667 | $1,667 | $1,000 |
| 2018 | $129 | $5,163 | $3,333 | $1,830 |
| 2017 | $447 | $11,013 | $3,333 | $7,680 |
| 2016 | $326 | $11,013 | $3,333 | $7,680 |
| 2015 | -- | $11,013 | $3,333 | $7,680 |
| 2014 | -- | $11,013 | $3,333 | $7,680 |
| 2013 | -- | $11,013 | $3,333 | $7,680 |
Source: Public Records
Map
Nearby Homes