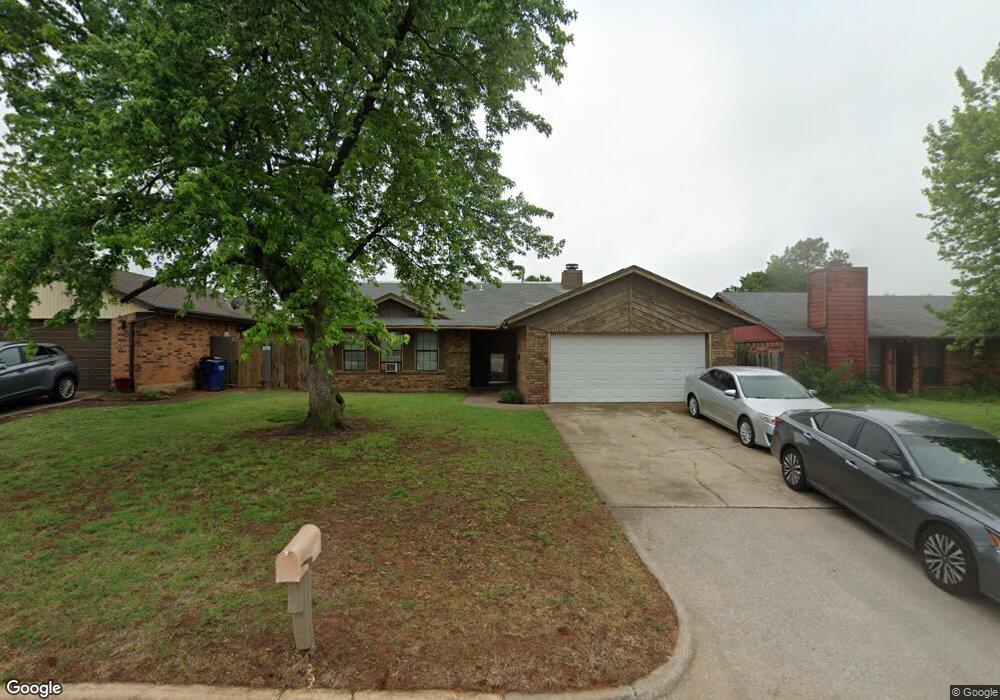
1009 N Crystal Way Mustang, OK 73064
Estimated Value: $181,000 - $204,000
3
Beds
2
Baths
1,209
Sq Ft
$157/Sq Ft
Est. Value
About This Home
This home is located at 1009 N Crystal Way, Mustang, OK 73064 and is currently estimated at $189,323, approximately $156 per square foot. 1009 N Crystal Way is a home located in Canadian County with nearby schools including Mustang Lakehoma Elementary School, Mustang Horizon Intermediate School, and Mustang Middle School.
Ownership History
Date
Name
Owned For
Owner Type
Purchase Details
Closed on
May 26, 2010
Sold by
Kincannon Connie R
Bought by
Davidson April C
Current Estimated Value
Home Financials for this Owner
Home Financials are based on the most recent Mortgage that was taken out on this home.
Original Mortgage
$102,815
Outstanding Balance
$71,164
Interest Rate
5.65%
Mortgage Type
FHA
Estimated Equity
$118,159
Purchase Details
Closed on
Apr 19, 2005
Sold by
Imhof Martha Jean and Imhof Daryl A
Bought by
Kincannon Connie R
Home Financials for this Owner
Home Financials are based on the most recent Mortgage that was taken out on this home.
Original Mortgage
$69,200
Interest Rate
6.97%
Mortgage Type
Adjustable Rate Mortgage/ARM
Purchase Details
Closed on
Nov 29, 1990
Purchase Details
Closed on
Dec 11, 1989
Purchase Details
Closed on
Sep 29, 1987
Create a Home Valuation Report for This Property
The Home Valuation Report is an in-depth analysis detailing your home's value as well as a comparison with similar homes in the area
Home Values in the Area
Average Home Value in this Area
Purchase History
| Date | Buyer | Sale Price | Title Company |
|---|---|---|---|
| Davidson April C | $104,500 | Ort | |
| Kincannon Connie R | $64,875 | None Available | |
| -- | -- | -- | |
| -- | -- | -- | |
| -- | -- | -- |
Source: Public Records
Mortgage History
| Date | Status | Borrower | Loan Amount |
|---|---|---|---|
| Open | Davidson April C | $102,815 | |
| Previous Owner | Kincannon Connie R | $69,200 |
Source: Public Records
Tax History Compared to Growth
Tax History
| Year | Tax Paid | Tax Assessment Tax Assessment Total Assessment is a certain percentage of the fair market value that is determined by local assessors to be the total taxable value of land and additions on the property. | Land | Improvement |
|---|---|---|---|---|
| 2024 | $1,136 | $12,759 | $2,427 | $10,332 |
| 2023 | $1,136 | $12,387 | $2,310 | $10,077 |
| 2022 | $1,113 | $12,027 | $2,169 | $9,858 |
| 2021 | $1,082 | $11,677 | $1,819 | $9,858 |
| 2020 | $1,054 | $11,336 | $1,440 | $9,896 |
| 2019 | $1,021 | $11,006 | $1,440 | $9,566 |
| 2018 | $1,009 | $10,685 | $1,440 | $9,245 |
| 2017 | $970 | $10,414 | $1,440 | $8,974 |
| 2016 | $941 | $10,304 | $1,440 | $8,864 |
| 2015 | $1,214 | $9,816 | $1,440 | $8,376 |
| 2014 | $1,214 | $12,688 | $1,440 | $11,248 |
Source: Public Records
Map
Nearby Homes
- 913 N Kirk Way
- 912 N Barn Hill Way
- 805 W Old Farm Way
- 0 N Czech Hall Rd
- 1250 N Tea Olive Way
- 1401 N Golden Bell Way
- 608 N Remington Way
- 1408 N Golden Bell Way
- 500 N Remington Way
- 601 N Chisholm Trail Way
- 1308 W Harvard Way
- 1316 W Harvard Way
- 304 N Geronimo Way
- 557 W Pine Rose Court Way
- 1401 W Harvard Way
- 1933 W Antler Way
- 313 N Shannon Way
- 534 W Pine Rose Court Way
- 1400 Quail Lake Way
- 1425 W Harvard Way
- 1013 N Crystal Way
- 1005 N Crystal Way
- 1001 N Crystal Way
- 1017 N Crystal Way
- 1010 N Kirk Way
- 1006 N Kirk Way
- 1014 N Kirk Way
- 921 N Crystal Way
- 1002 N Kirk Way
- 1018 N Kirk Way
- 1010 N Crystal Way
- 1006 N Crystal Way
- 1014 N Crystal Way
- 1002 N Crystal Way
- 906 W Ridgehaven Way
- 922 N Kirk Way
- 917 N Crystal Way
- 922 N Crystal Way
- 919 W Ridgehaven Way
- 915 W Ridgehaven Way