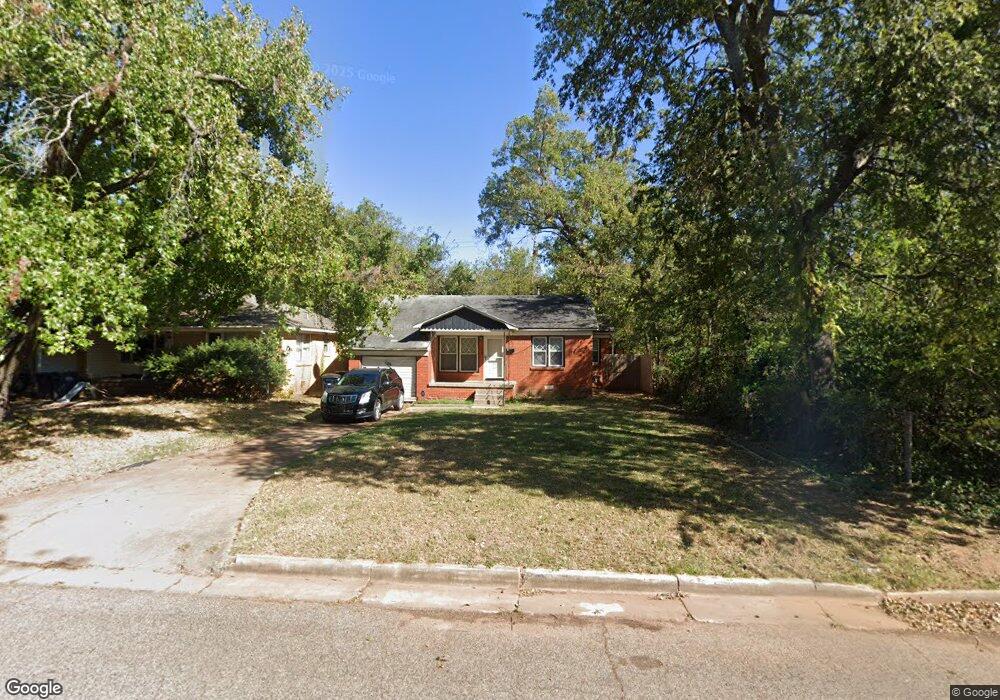
1009 N Market Ave Shawnee, OK 74801
Estimated Value: $85,000 - $140,000
3
Beds
2
Baths
1,080
Sq Ft
$97/Sq Ft
Est. Value
About This Home
This home is located at 1009 N Market Ave, Shawnee, OK 74801 and is currently estimated at $104,643, approximately $96 per square foot. 1009 N Market Ave is a home located in Pottawatomie County with nearby schools including Jefferson Elementary School, Shawnee Middle School, and Shawnee High School.
Ownership History
Date
Name
Owned For
Owner Type
Purchase Details
Closed on
Aug 24, 2016
Sold by
Taylor Bradley J
Bought by
Thompson Darren and Thompson Shawna
Current Estimated Value
Purchase Details
Closed on
Aug 6, 2013
Sold by
Jpmorgan Chase Bank Na
Bought by
Taylor Bradley J
Purchase Details
Closed on
Apr 16, 2013
Sold by
Murdock Heather M and Thompson Heather M
Bought by
Jpmorgan Chase Bank National Association
Purchase Details
Closed on
Jul 2, 2007
Sold by
Richards Shelli D and Richards Daniel
Bought by
Murdock Heather M
Home Financials for this Owner
Home Financials are based on the most recent Mortgage that was taken out on this home.
Original Mortgage
$66,326
Interest Rate
6.19%
Mortgage Type
Unknown
Purchase Details
Closed on
Dec 8, 1992
Sold by
Hud
Bought by
Wells Kathryn
Purchase Details
Closed on
Apr 3, 1992
Sold by
Sheriff
Bought by
Hud
Create a Home Valuation Report for This Property
The Home Valuation Report is an in-depth analysis detailing your home's value as well as a comparison with similar homes in the area
Home Values in the Area
Average Home Value in this Area
Purchase History
| Date | Buyer | Sale Price | Title Company |
|---|---|---|---|
| Thompson Darren | $68,000 | Chicago Title Insurance | |
| Taylor Bradley J | $31,000 | First American Title | |
| Jpmorgan Chase Bank National Association | -- | None Available | |
| Murdock Heather M | $58,500 | None Available | |
| Wells Kathryn | -- | -- | |
| Hud | -- | -- |
Source: Public Records
Mortgage History
| Date | Status | Borrower | Loan Amount |
|---|---|---|---|
| Previous Owner | Murdock Heather M | $66,326 |
Source: Public Records
Tax History Compared to Growth
Tax History
| Year | Tax Paid | Tax Assessment Tax Assessment Total Assessment is a certain percentage of the fair market value that is determined by local assessors to be the total taxable value of land and additions on the property. | Land | Improvement |
|---|---|---|---|---|
| 2025 | $862 | $8,754 | $840 | $7,914 |
| 2024 | $832 | $8,366 | $840 | $7,526 |
| 2023 | $832 | $7,968 | $840 | $7,128 |
| 2022 | $818 | $7,968 | $840 | $7,128 |
| 2021 | $779 | $7,734 | $900 | $6,834 |
| 2020 | $795 | $7,868 | $900 | $6,968 |
| 2019 | $849 | $8,133 | $900 | $7,233 |
| 2018 | $827 | $8,080 | $900 | $7,180 |
| 2017 | $826 | $8,184 | $900 | $7,284 |
| 2016 | $301 | $3,946 | $108 | $3,838 |
| 2015 | $283 | $3,832 | $105 | $3,727 |
| 2014 | $272 | $3,720 | $420 | $3,300 |
Source: Public Records
Map
Nearby Homes
- 1006 N Market Ave
- 1017 N Bdwy Ave
- 320 W Dill St
- 1217 N Market Ave
- 318 W Dill St
- 317 W Dill St
- 735 N Park Ave
- 920 N Kickapoo Ave
- 727 N Beard Ave
- 1324 N Park Ave
- 114 E Wallace St
- 810 N Kickapoo Ave
- 717 N Broadway Ave
- 1012 N Chapman Ave
- 542 W Wood St
- 1607 N Beard Ave
- 634 N Louisa Ave
- 615 N Park Ave
- 1510 N Union Ave
- 128 W Ridgewood St
- 1011 N Market Ave
- 123 W Kirk St
- 112 W Burns St
- 1001 N Market Ave
- 1024 N Beard St
- 1020 N Beard St
- 1016 N Beard St
- 1012 N Beard St
- 1004 N Beard St
- 1002 N Beard St
- 1016 N Beard Ave
- 1012 N Market Ave
- 1008 N Market Ave
- 1004 N Market Ave
- 1010 N Market Ave
- 1002 N Market Ave
- 111 W Burns St
- 1101 N Market Ave
- 1021 N Beard St
- 1011 N Beard St