Estimated Value: $134,000 - $162,000
3
Beds
1
Bath
1,682
Sq Ft
$88/Sq Ft
Est. Value
About This Home
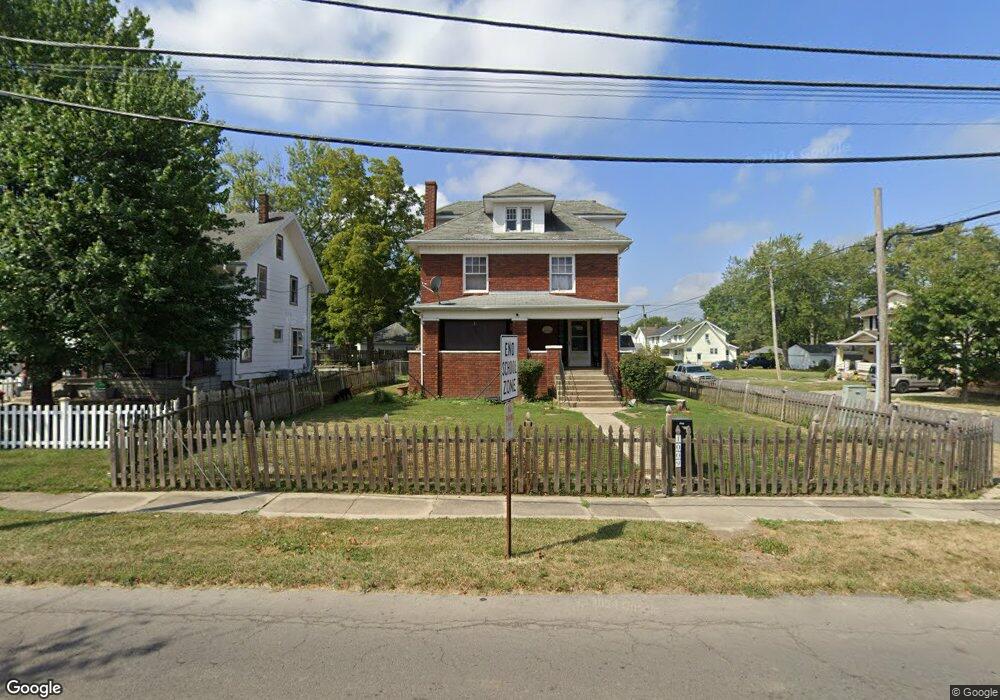
This home is located at 1009 N Metcalf St, Lima, OH 45801 and is currently estimated at $147,182, approximately $87 per square foot. 1009 N Metcalf St is a home located in Allen County with nearby schools including Independence Elementary School, Lima North Middle School, and Lima West Middle School.
Ownership History
Date
Name
Owned For
Owner Type
Purchase Details
Closed on
Feb 12, 2007
Sold by
Restoration Homes Llc
Bought by
Bartley Gordon W
Current Estimated Value
Home Financials for this Owner
Home Financials are based on the most recent Mortgage that was taken out on this home.
Original Mortgage
$84,829
Outstanding Balance
$51,006
Interest Rate
6.23%
Mortgage Type
FHA
Estimated Equity
$96,176
Purchase Details
Closed on
Aug 29, 2006
Sold by
Dumage Jeffrey A and Dumage Sarah E
Bought by
Restoration Homes Llc
Home Financials for this Owner
Home Financials are based on the most recent Mortgage that was taken out on this home.
Original Mortgage
$53,000
Interest Rate
6.7%
Mortgage Type
Future Advance Clause Open End Mortgage
Purchase Details
Closed on
Jan 11, 2006
Sold by
Bowers David F and Bowers Carol L
Bought by
Dulmage Jeffrey A
Purchase Details
Closed on
Oct 7, 1991
Bought by
Bowers David F
Create a Home Valuation Report for This Property
The Home Valuation Report is an in-depth analysis detailing your home's value as well as a comparison with similar homes in the area
Home Values in the Area
Average Home Value in this Area
Purchase History
| Date | Buyer | Sale Price | Title Company |
|---|---|---|---|
| Bartley Gordon W | $85,500 | None Available | |
| Restoration Homes Llc | -- | None Available | |
| Dulmage Jeffrey A | $34,700 | None Available | |
| Bowers David F | $44,000 | -- |
Source: Public Records
Mortgage History
| Date | Status | Borrower | Loan Amount |
|---|---|---|---|
| Open | Bartley Gordon W | $84,829 | |
| Previous Owner | Restoration Homes Llc | $53,000 |
Source: Public Records
Tax History Compared to Growth
Tax History
| Year | Tax Paid | Tax Assessment Tax Assessment Total Assessment is a certain percentage of the fair market value that is determined by local assessors to be the total taxable value of land and additions on the property. | Land | Improvement |
|---|---|---|---|---|
| 2024 | $1,347 | $36,620 | $3,960 | $32,660 |
| 2023 | $1,220 | $28,850 | $3,120 | $25,730 |
| 2022 | $1,227 | $28,850 | $3,120 | $25,730 |
| 2021 | $1,302 | $28,850 | $3,120 | $25,730 |
| 2020 | $1,757 | $24,400 | $3,010 | $21,390 |
| 2019 | $1,757 | $24,400 | $3,010 | $21,390 |
| 2018 | $1,233 | $24,400 | $3,010 | $21,390 |
| 2017 | $1,251 | $24,400 | $3,010 | $21,390 |
| 2016 | $1,268 | $24,400 | $3,010 | $21,390 |
| 2015 | $1,373 | $24,400 | $3,010 | $21,390 |
| 2014 | $1,373 | $26,810 | $2,940 | $23,870 |
| 2013 | $1,336 | $26,810 | $2,940 | $23,870 |
Source: Public Records
Map
Nearby Homes
- 576 Cortlandt Ave
- 1116 Belvidere Ave
- 939 N West St
- 416 Hazel Ave
- 608 W O'Connor Ave
- 222 W Grand Ave
- 708 N Metcalf St
- 676 Cortlandt Ave
- 638 Hazel Ave
- 765 W O'Connor Ave
- 648 Hazel Ave
- 631 Hazel Ave
- 849 Runyan Ave
- 612 N Metcalf St
- 610 W Robb Ave
- 606 N West St
- 340 W Robb Ave
- 616 N Elizabeth St
- 820 N Main St
- 123 Flanders Ave