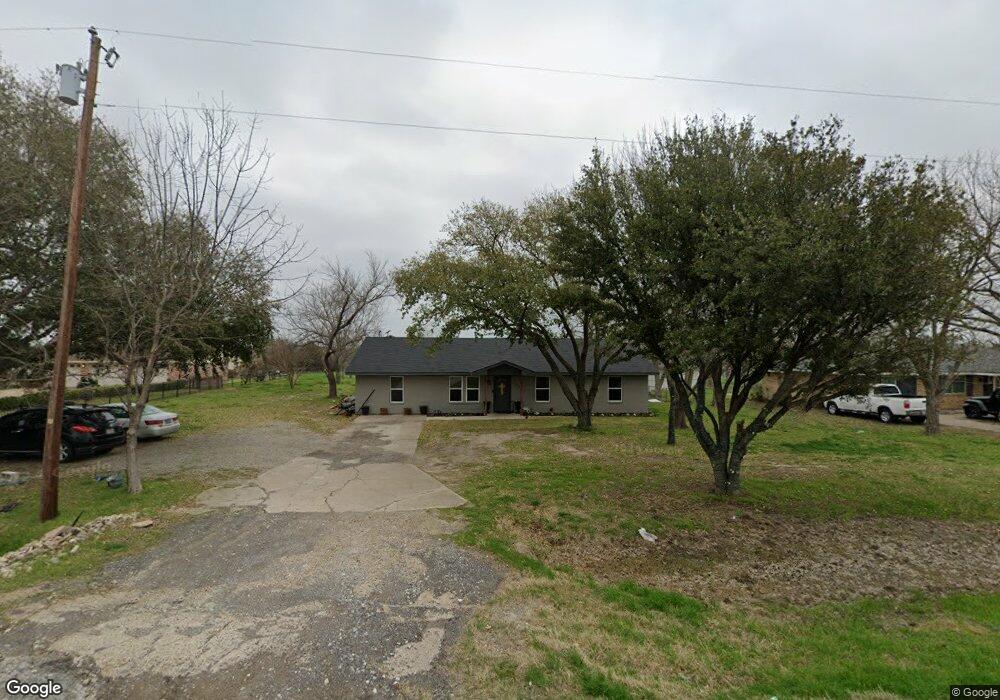
1009 N Spikes Rd Corsicana, TX 75110
Estimated Value: $277,290 - $395,000
4
Beds
2
Baths
1,980
Sq Ft
$167/Sq Ft
Est. Value
About This Home
This home is located at 1009 N Spikes Rd, Corsicana, TX 75110 and is currently estimated at $330,073, approximately $166 per square foot. 1009 N Spikes Rd is a home located in Navarro County with nearby schools including Corsicana High School.
Ownership History
Date
Name
Owned For
Owner Type
Purchase Details
Closed on
Feb 18, 2023
Sold by
Six Fourteen Properties Llc
Bought by
Alvarenga Luis and Saldana Guadalupe
Current Estimated Value
Home Financials for this Owner
Home Financials are based on the most recent Mortgage that was taken out on this home.
Original Mortgage
$345,000
Outstanding Balance
$320,440
Interest Rate
6.48%
Mortgage Type
Seller Take Back
Estimated Equity
$9,633
Purchase Details
Closed on
Jan 28, 2022
Sold by
Terry Stewart Carolyn Elaine
Bought by
Six Fourteen Properties Llc
Purchase Details
Closed on
Jan 26, 2022
Sold by
Cox Rash Carol
Bought by
Stewart Carolyn Elaine Terry
Purchase Details
Closed on
Jan 21, 2022
Sold by
Louise Bonner Audrey
Bought by
Stewart Carolyn
Purchase Details
Closed on
Jan 11, 2022
Sold by
Louise Bonner Audrey
Bought by
Booner Audrey Louise
Purchase Details
Closed on
Aug 31, 2021
Sold by
Bonner Audrey Louise
Bought by
Stewart Carolyn
Create a Home Valuation Report for This Property
The Home Valuation Report is an in-depth analysis detailing your home's value as well as a comparison with similar homes in the area
Home Values in the Area
Average Home Value in this Area
Purchase History
| Date | Buyer | Sale Price | Title Company |
|---|---|---|---|
| Alvarenga Luis | -- | Royal Title Services | |
| Six Fourteen Properties Llc | -- | Micro Title | |
| Stewart Carolyn Elaine Terry | -- | None Listed On Document | |
| Stewart Carolyn | -- | None Listed On Document | |
| Booner Audrey Louise | -- | Waggoner David K | |
| Stewart Carolyn | -- | None Available |
Source: Public Records
Mortgage History
| Date | Status | Borrower | Loan Amount |
|---|---|---|---|
| Open | Alvarenga Luis | $345,000 |
Source: Public Records
Tax History Compared to Growth
Tax History
| Year | Tax Paid | Tax Assessment Tax Assessment Total Assessment is a certain percentage of the fair market value that is determined by local assessors to be the total taxable value of land and additions on the property. | Land | Improvement |
|---|---|---|---|---|
| 2025 | $3,736 | $267,100 | $46,000 | $221,100 |
| 2024 | $3,711 | $265,310 | $35,000 | $230,310 |
| 2023 | $3,545 | $254,440 | $43,560 | $210,880 |
| 2022 | $2,958 | $165,560 | $16,500 | $149,060 |
| 2021 | $2,715 | $136,600 | $10,000 | $126,600 |
| 2020 | $2,743 | $135,360 | $10,000 | $125,360 |
| 2019 | $2,798 | $132,040 | $10,000 | $122,040 |
| 2018 | $2,647 | $130,040 | $8,000 | $122,040 |
| 2017 | $2,402 | $115,780 | $7,000 | $108,780 |
| 2016 | $2,184 | $103,220 | $6,050 | $97,170 |
| 2015 | -- | $101,380 | $5,500 | $95,880 |
| 2014 | -- | $101,380 | $5,500 | $95,880 |
Source: Public Records
Map
Nearby Homes
- 815 N Spikes Rd
- TBD 20 Acres Ingham Rd
- 2170 Texas 31
- Lot 63 Sunset Cir
- 1402 SW County Road 1030
- 113 S Spikes Rd
- TBD S 37th St
- 735 SE County Road 0025
- 313 Martin Rd
- 0 S Business 45
- 3001 Hillsdale St
- 3024 SW County Road 0010
- 1511 W 13th Ave
- 3231 Hillsdale Ave
- Lot 9-R W 16th Ave
- TBD S 31st St
- 1325 W 13th Ave
- 1706 W 12th Ave
- 2215 W Park Row Blvd
- 610 S 28th St
- 1005 N Spikes Rd
- 1013 N Spikes Rd
- 1001 N Spikes Rd
- N/A N Spikes #2 Rd
- 1017 N Spikes Rd
- 913 N Spikes Rd
- 905 N Spikes Rd
- 113 Ingham Rd
- 000 Farm To Market 709
- 906 N Spikes Rd
- 117 Ingham Rd
- 816 N Spikes Rd
- 112 Ranchland Rd
- 116 Ranchland Rd
- 108 Ranchland Rd
- 120 Ranchland Rd
- 1102 N Spikes Rd
- 104 Ranchland Rd
- 125 Ingham Rd
- 124 Ranchland Rd