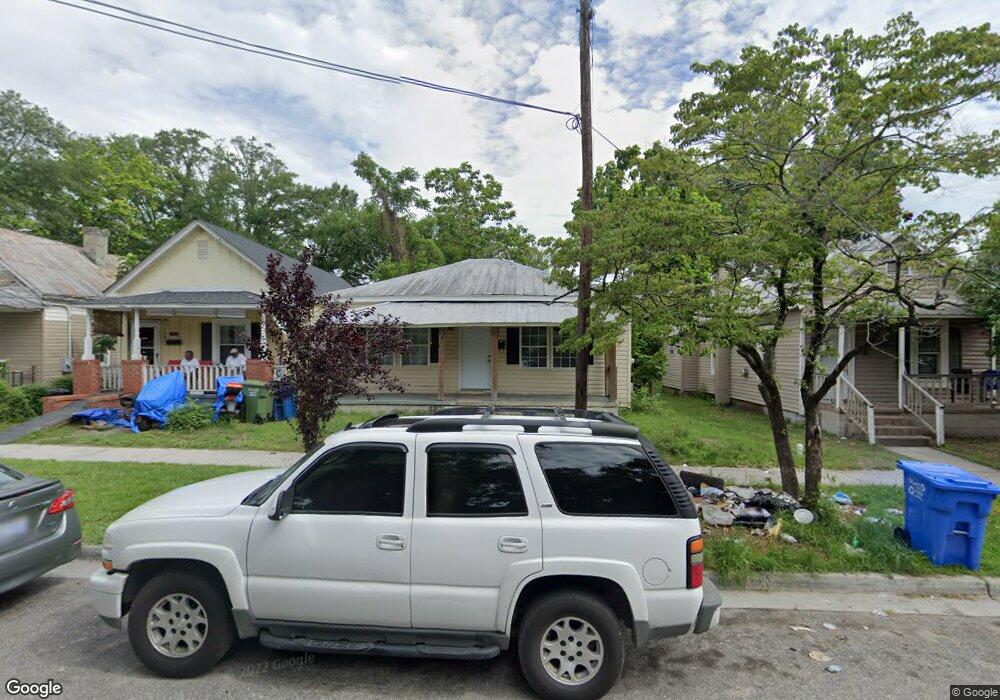
1009 Queen St Wilmington, NC 28401
Dry Pond-South Side NeighborhoodEstimated Value: $144,000 - $277,000
3
Beds
1
Bath
1,072
Sq Ft
$189/Sq Ft
Est. Value
About This Home
This home is located at 1009 Queen St, Wilmington, NC 28401 and is currently estimated at $202,421, approximately $188 per square foot. 1009 Queen St is a home located in New Hanover County with nearby schools including Forest Hills Global Elementary School, Williston Middle School, and John T. Hoggard High School.
Ownership History
Date
Name
Owned For
Owner Type
Purchase Details
Closed on
Feb 22, 2016
Sold by
Bigoness John and Bigoness Roxanne
Bought by
Hill Construction Llc
Current Estimated Value
Purchase Details
Closed on
Aug 16, 2010
Sold by
Bac Home Loans Servicing Lp
Bought by
Bigoness Jack
Purchase Details
Closed on
Mar 22, 2010
Sold by
Craddock Jimmy
Bought by
Bac Home Loans Servicing Lp and Countrywide Home Loans Servicing Lp
Purchase Details
Closed on
Feb 1, 1995
Sold by
Webb Cleo W
Bought by
Craddock Jimmy
Purchase Details
Closed on
Oct 1, 1976
Bought by
Webb Cleo W
Create a Home Valuation Report for This Property
The Home Valuation Report is an in-depth analysis detailing your home's value as well as a comparison with similar homes in the area
Home Values in the Area
Average Home Value in this Area
Purchase History
| Date | Buyer | Sale Price | Title Company |
|---|---|---|---|
| Hill Construction Llc | -- | None Available | |
| Bigoness Jack | $20,500 | None Available | |
| Bac Home Loans Servicing Lp | $34,200 | None Available | |
| Craddock Jimmy | -- | -- | |
| Webb Cleo W | $1,500 | -- |
Source: Public Records
Tax History
| Year | Tax Paid | Tax Assessment Tax Assessment Total Assessment is a certain percentage of the fair market value that is determined by local assessors to be the total taxable value of land and additions on the property. | Land | Improvement |
|---|---|---|---|---|
| 2025 | $744 | $126,400 | $69,600 | $56,800 |
| 2023 | $1,177 | $139,300 | $48,900 | $90,400 |
| 2022 | $1,184 | $139,300 | $48,900 | $90,400 |
| 2021 | $1,192 | $139,300 | $48,900 | $90,400 |
| 2020 | $529 | $50,200 | $10,800 | $39,400 |
| 2019 | $529 | $50,200 | $10,800 | $39,400 |
| 2018 | $529 | $50,200 | $10,800 | $39,400 |
| 2017 | $529 | $50,200 | $10,800 | $39,400 |
| 2016 | $524 | $47,300 | $20,000 | $27,300 |
| 2015 | $501 | $47,300 | $20,000 | $27,300 |
| 2014 | $480 | $47,300 | $20,000 | $27,300 |
Source: Public Records
Map
Nearby Homes
Your Personal Tour Guide
Ask me questions while you tour the home.