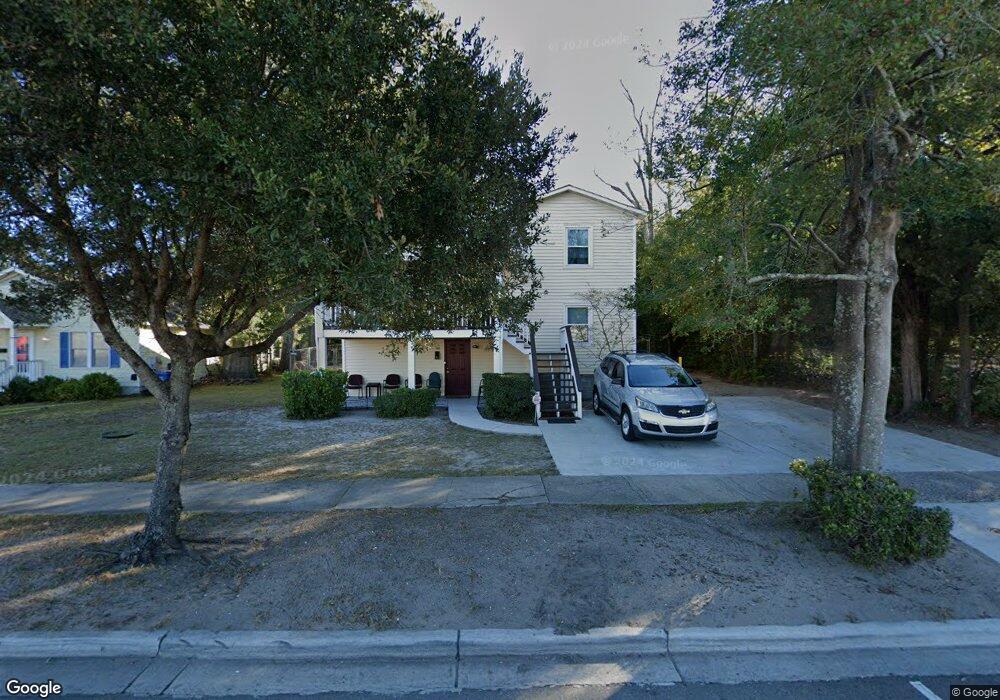
1009 S 3rd St Wilmington, NC 28401
Dry Pond-South Side NeighborhoodEstimated Value: $474,000 - $813,000
5
Beds
3
Baths
2,360
Sq Ft
$285/Sq Ft
Est. Value
About This Home
This home is located at 1009 S 3rd St, Wilmington, NC 28401 and is currently estimated at $671,505, approximately $284 per square foot. 1009 S 3rd St is a home located in New Hanover County with nearby schools including Snipes Academy of Arts & Design, Williston Middle School, and New Hanover High School.
Ownership History
Date
Name
Owned For
Owner Type
Purchase Details
Closed on
Mar 13, 1995
Sold by
Cape Fear Habitat For Humanity
Bought by
Sanders Sammie Mary
Current Estimated Value
Purchase Details
Closed on
Mar 9, 1995
Sold by
New Hanover County
Bought by
Cape Fear Habitat For Humanity
Purchase Details
Closed on
Aug 11, 1994
Sold by
New Han Cnty/Wilmington City
Bought by
Cape Fear Habitat For Humanity
Purchase Details
Closed on
Jun 30, 1993
Sold by
Mcqueen Joseph Jr Sheriff
Bought by
New Han Cnty/Wilmington City
Purchase Details
Closed on
Feb 9, 1954
Bought by
Mahan Evelyn A Life Estate
Create a Home Valuation Report for This Property
The Home Valuation Report is an in-depth analysis detailing your home's value as well as a comparison with similar homes in the area
Home Values in the Area
Average Home Value in this Area
Purchase History
| Date | Buyer | Sale Price | Title Company |
|---|---|---|---|
| Sanders Sammie Mary | $33,500 | -- | |
| Cape Fear Habitat For Humanity | -- | -- | |
| Cape Fear Habitat For Humanity | -- | -- | |
| New Han Cnty/Wilmington City | -- | -- | |
| Mahan Evelyn A Life Estate | -- | -- |
Source: Public Records
Tax History
| Year | Tax Paid | Tax Assessment Tax Assessment Total Assessment is a certain percentage of the fair market value that is determined by local assessors to be the total taxable value of land and additions on the property. | Land | Improvement |
|---|---|---|---|---|
| 2025 | -- | $623,700 | $248,700 | $375,000 |
| 2023 | $995 | $240,200 | $69,200 | $171,000 |
| 2022 | $1,531 | $240,200 | $69,200 | $171,000 |
| 2021 | $322 | $240,200 | $69,200 | $171,000 |
| 2020 | $1,492 | $141,600 | $46,300 | $95,300 |
| 2019 | $1,492 | $141,600 | $46,300 | $95,300 |
| 2018 | $1,112 | $141,600 | $46,300 | $95,300 |
| 2017 | $1,492 | $141,600 | $46,300 | $95,300 |
| 2016 | $2,423 | $218,700 | $74,800 | $143,900 |
| 2015 | $2,316 | $218,700 | $74,800 | $143,900 |
| 2014 | $2,218 | $218,700 | $74,800 | $143,900 |
Source: Public Records
Map
Nearby Homes
Your Personal Tour Guide
Ask me questions while you tour the home.