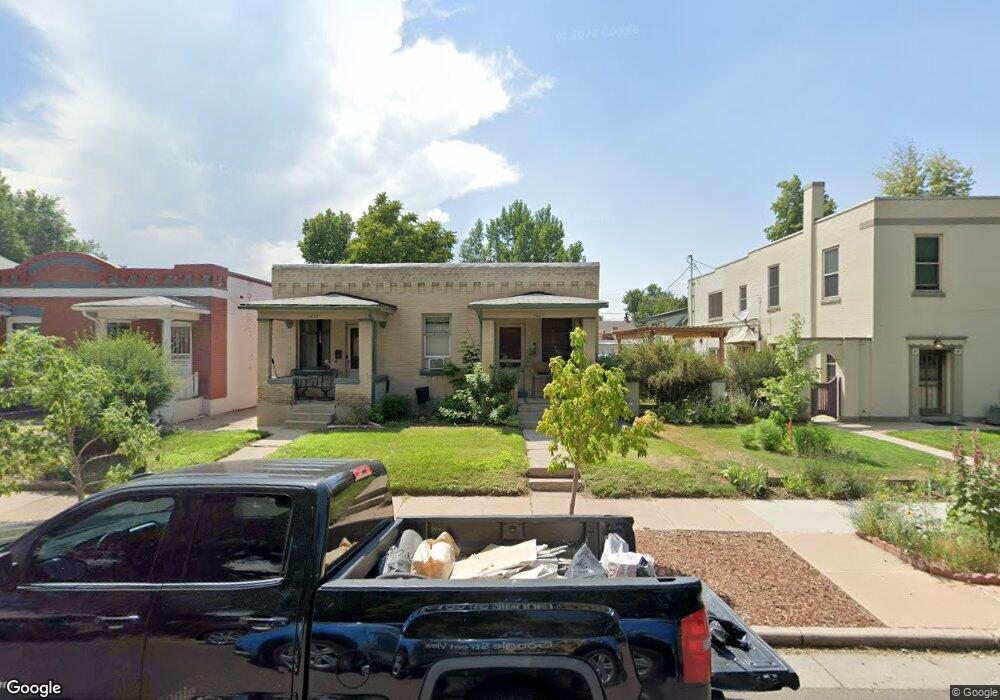
1009 S Clarkson St Unit 1011 Denver, CO 80209
Washington Park West NeighborhoodEstimated Value: $421,435 - $751,000
2
Beds
1
Bath
1,017
Sq Ft
$576/Sq Ft
Est. Value
About This Home
This home is located at 1009 S Clarkson St Unit 1011, Denver, CO 80209 and is currently estimated at $586,218, approximately $576 per square foot. 1009 S Clarkson St Unit 1011 is a home located in Denver County with nearby schools including Lincoln Elementary School, Grant Beacon Middle School, and South High School.
Ownership History
Date
Name
Owned For
Owner Type
Purchase Details
Closed on
May 12, 2015
Sold by
Jenkins Joseph J
Bought by
Sperry Bryan
Current Estimated Value
Purchase Details
Closed on
May 11, 2009
Sold by
Texas Ventures Llc
Bought by
Jenkins Patricia A
Purchase Details
Closed on
Sep 19, 2005
Sold by
Chelton Property Llc
Bought by
Texas Ventures Llc
Purchase Details
Closed on
Oct 24, 2003
Sold by
Maryland Corp
Bought by
Chelton Property Llc
Purchase Details
Closed on
Jan 1, 1996
Sold by
Sperry Bryan Lee
Bought by
Sperry Investments Sd Corp
Purchase Details
Closed on
Dec 17, 1993
Sold by
Zieper James S and Sperry Bryan Lee
Bought by
Sperry Bryan Lee
Create a Home Valuation Report for This Property
The Home Valuation Report is an in-depth analysis detailing your home's value as well as a comparison with similar homes in the area
Home Values in the Area
Average Home Value in this Area
Purchase History
| Date | Buyer | Sale Price | Title Company |
|---|---|---|---|
| Sperry Bryan | -- | None Available | |
| Sperry Bryan | -- | None Available | |
| Jenkins Patricia A | -- | Stewart Title | |
| Jenkins Joseph J | -- | Stewart Title | |
| Sperry Bryan | -- | Stewart Title | |
| Texas Ventures Llc | -- | None Available | |
| Chelton Property Llc | -- | Chicago Title Co | |
| Sperry Investments Sd Corp | -- | -- | |
| Sperry Bryan Lee | $100,500 | Land Title |
Source: Public Records
Tax History Compared to Growth
Tax History
| Year | Tax Paid | Tax Assessment Tax Assessment Total Assessment is a certain percentage of the fair market value that is determined by local assessors to be the total taxable value of land and additions on the property. | Land | Improvement |
|---|---|---|---|---|
| 2024 | $3,688 | $46,560 | $30,340 | $16,220 |
| 2023 | $4,127 | $53,260 | $30,340 | $22,920 |
| 2022 | $3,016 | $37,930 | $28,530 | $9,400 |
| 2021 | $2,976 | $39,880 | $30,000 | $9,880 |
| 2020 | $3,243 | $43,710 | $28,420 | $15,290 |
| 2019 | $3,152 | $43,710 | $28,420 | $15,290 |
| 2018 | $2,878 | $37,200 | $25,210 | $11,990 |
| 2017 | $2,869 | $37,200 | $25,210 | $11,990 |
| 2016 | $2,405 | $29,490 | $25,265 | $4,225 |
| 2015 | $2,304 | $32,130 | $25,265 | $6,865 |
| 2014 | $1,947 | $23,440 | $21,094 | $2,346 |
Source: Public Records
Map
Nearby Homes
- 995 S Clarkson St
- 1127 S Ogden St
- 912 S Washington St
- 969 S Pearl St Unit 204
- 1152 S Ogden St
- 1050 S Corona St
- 888 S Emerson St
- 1260 S Emerson St
- 848 S Corona St
- 1145 S Logan St
- 873 S Logan St
- 1313 S Clarkson St Unit 405
- 1313 S Clarkson St Unit 202
- 1313 S Clarkson St Unit 307
- 760 S Pearl St
- 732 S Clarkson St
- 739 S Ogden St
- 1160 S Sherman St
- 857 S Grant St
- 1359 S Corona St
- 1019 S Clarkson St
- 1023 S Clarkson St
- 730 E Tennessee Ave Unit 740
- 1025 S Clarkson St
- 1031 S Clarkson St Unit 1033
- 1029 S Clarkson St
- 1020 S Washington St Unit 1022
- 1010 S Clarkson St
- 1016 S Washington St
- 1016 S Clarkson St
- 1004 S Washington St
- 1000 S Washington St
- 1000 S Clarkson St
- 1020 S Clarkson St
- 1026 S Clarkson St
- 1039 S Clarkson St
- 1026 S Washington St
- 1030 S Washington St
- 989 S Clarkson St
- 1036 S Clarkson St