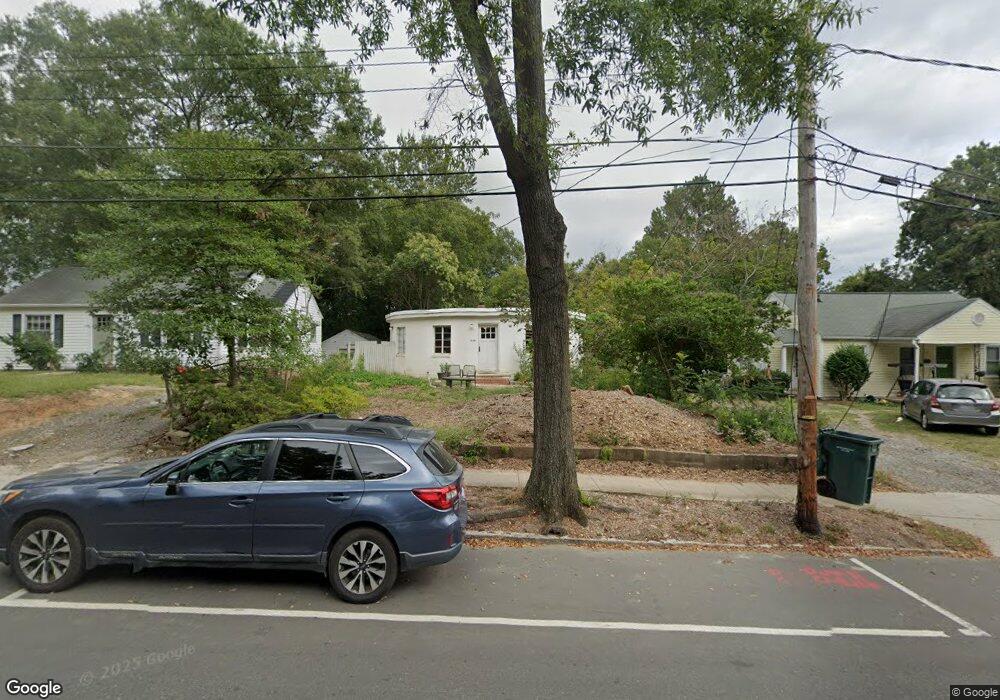
1009 S Duke St Durham, NC 27707
Historic West End NeighborhoodEstimated Value: $341,000 - $442,000
3
Beds
1
Bath
921
Sq Ft
$415/Sq Ft
Est. Value
About This Home
This home is located at 1009 S Duke St, Durham, NC 27707 and is currently estimated at $382,426, approximately $415 per square foot. 1009 S Duke St is a home located in Durham County with nearby schools including Morehead Montessori, Lakewood Montessori Middle School, and Jordan High School.
Ownership History
Date
Name
Owned For
Owner Type
Purchase Details
Closed on
Oct 30, 2014
Sold by
Arnold Matthew D
Bought by
Arnold Matthew D and Oh David Young
Current Estimated Value
Home Financials for this Owner
Home Financials are based on the most recent Mortgage that was taken out on this home.
Original Mortgage
$123,200
Outstanding Balance
$95,375
Interest Rate
4.29%
Mortgage Type
New Conventional
Estimated Equity
$287,051
Purchase Details
Closed on
Oct 27, 2014
Sold by
Overman Catherine S and Hayes Michael C
Bought by
Arnold Matthew David
Home Financials for this Owner
Home Financials are based on the most recent Mortgage that was taken out on this home.
Original Mortgage
$123,200
Outstanding Balance
$95,375
Interest Rate
4.29%
Mortgage Type
New Conventional
Estimated Equity
$287,051
Purchase Details
Closed on
Nov 30, 1999
Sold by
Williams Lee R and Williams Susan R
Bought by
Overman Catherine
Home Financials for this Owner
Home Financials are based on the most recent Mortgage that was taken out on this home.
Original Mortgage
$55,100
Interest Rate
7.94%
Create a Home Valuation Report for This Property
The Home Valuation Report is an in-depth analysis detailing your home's value as well as a comparison with similar homes in the area
Home Values in the Area
Average Home Value in this Area
Purchase History
| Date | Buyer | Sale Price | Title Company |
|---|---|---|---|
| Arnold Matthew D | -- | None Available | |
| Arnold Matthew David | $154,000 | None Available | |
| Overman Catherine | $58,000 | -- |
Source: Public Records
Mortgage History
| Date | Status | Borrower | Loan Amount |
|---|---|---|---|
| Open | Arnold Matthew David | $123,200 | |
| Previous Owner | Overman Catherine | $55,100 |
Source: Public Records
Tax History
| Year | Tax Paid | Tax Assessment Tax Assessment Total Assessment is a certain percentage of the fair market value that is determined by local assessors to be the total taxable value of land and additions on the property. | Land | Improvement |
|---|---|---|---|---|
| 2025 | $3,397 | $342,651 | $252,000 | $90,651 |
| 2024 | $1,715 | $122,977 | $69,135 | $53,842 |
| 2023 | $1,611 | $122,977 | $69,135 | $53,842 |
| 2022 | $1,574 | $122,977 | $69,135 | $53,842 |
| 2021 | $1,567 | $122,977 | $69,135 | $53,842 |
| 2020 | $1,530 | $122,977 | $69,135 | $53,842 |
| 2019 | $1,530 | $122,977 | $69,135 | $53,842 |
| 2018 | $2,000 | $147,436 | $47,175 | $100,261 |
| 2017 | $1,985 | $147,436 | $47,175 | $100,261 |
| 2016 | $1,918 | $147,436 | $47,175 | $100,261 |
| 2015 | $1,607 | $116,121 | $44,647 | $71,474 |
| 2014 | $1,607 | $116,121 | $44,647 | $71,474 |
Source: Public Records
Map
Nearby Homes
- 779 Willard St
- 771 Willard St
- 1012 Manor Way
- 1014 Manor Way
- 914 South St
- 116 Chestnut St
- 301 W Enterprise St
- 518 Morehead Ave Unit 108
- 518 Morehead Ave Unit 100
- 518 Morehead Ave Unit 200
- 518 Morehead Ave Unit 202
- 518 Morehead Ave Unit 307
- 518 Morehead Ave Unit 101
- 518 Morehead Ave Unit 125
- 518 Morehead Ave Unit 504
- 518 Morehead Ave Unit 127
- 518 Morehead Ave Unit 304
- 917 Scout Dr
- 1106 Fargo St
- 708 S Roxboro St
- 1011 S Duke St
- 1007 S Duke St
- 1005 S Duke St
- 1013 S Duke St
- 1003 S Duke St
- 1015 S Duke St
- 1001 S Duke St
- 1017 S Duke St
- 1021 S Duke St
- 911 S Duke St
- 1023 S Duke St
- 1025 S Duke St
- 1029 S Duke St
- 909 S Duke St
- 1031 S Duke St
- 1033 S Duke St
- 749 Willard St Unit 7
- 1016 Manor Way
- 747 Willard St Unit 8
- 424 W Lakewood Ave
Your Personal Tour Guide
Ask me questions while you tour the home.