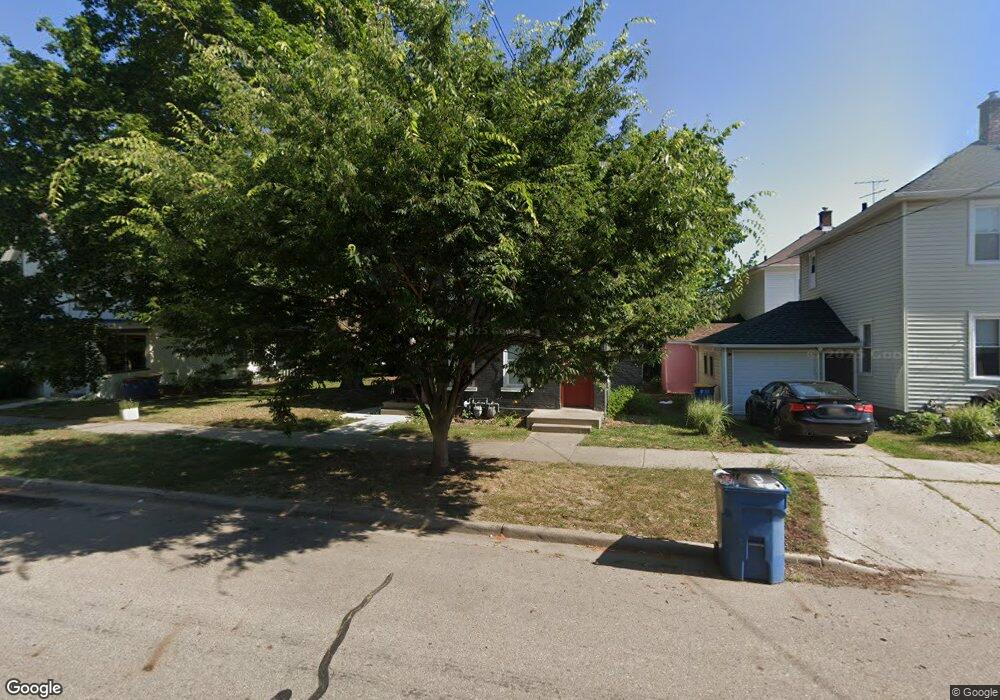
1009 Sibley St NW Grand Rapids, MI 49504
SWAN NeighborhoodEstimated Value: $212,000 - $300,000
--
Bed
--
Bath
2,178
Sq Ft
$121/Sq Ft
Est. Value
About This Home
This home is located at 1009 Sibley St NW, Grand Rapids, MI 49504 and is currently estimated at $264,575, approximately $121 per square foot. 1009 Sibley St NW is a home located in Kent County with nearby schools including Sibley School, Westwood Middle School, and Union High School.
Ownership History
Date
Name
Owned For
Owner Type
Purchase Details
Closed on
Nov 6, 2020
Sold by
Dannyboy Holdings Llc
Bought by
Tubergen Scott
Current Estimated Value
Home Financials for this Owner
Home Financials are based on the most recent Mortgage that was taken out on this home.
Original Mortgage
$120,000
Outstanding Balance
$106,783
Interest Rate
2.8%
Mortgage Type
Commercial
Estimated Equity
$157,792
Purchase Details
Closed on
Feb 11, 2020
Sold by
Curry Roy
Bought by
Dannyboy Holdings Llc
Purchase Details
Closed on
Jun 28, 2019
Sold by
Kraft Kimberly Jo and Newberry Kaye Lynn
Bought by
Bouma Twins Properties Llc
Purchase Details
Closed on
Feb 22, 2000
Sold by
Bouma Bouma M M and Bouma Ken
Bought by
Curry Roy
Purchase Details
Closed on
Feb 11, 2000
Sold by
Bouma Twins Propeties Llc
Bought by
Dannyboy Holdigns Llc
Purchase Details
Closed on
Jun 1, 1996
Sold by
Bouma Bouma K K and Bouma M
Bought by
Curry Curry R and Curry Roy
Purchase Details
Closed on
Jan 11, 1991
Sold by
Evans Evans P P and Evans Bouma K
Bought by
Curry Roy
Create a Home Valuation Report for This Property
The Home Valuation Report is an in-depth analysis detailing your home's value as well as a comparison with similar homes in the area
Home Values in the Area
Average Home Value in this Area
Purchase History
| Date | Buyer | Sale Price | Title Company |
|---|---|---|---|
| Tubergen Scott | $125,000 | None Available | |
| Dannyboy Holdings Llc | -- | Irongate Title Agency Llc | |
| Bouma Twins Properties Llc | -- | None Available | |
| Curry Roy | -- | -- | |
| Dannyboy Holdigns Llc | $8,500 | Irongate Title Agency Llc | |
| Curry Curry R | $48,000 | -- | |
| Curry Roy | $39,000 | -- |
Source: Public Records
Mortgage History
| Date | Status | Borrower | Loan Amount |
|---|---|---|---|
| Open | Tubergen Scott | $120,000 |
Source: Public Records
Tax History Compared to Growth
Tax History
| Year | Tax Paid | Tax Assessment Tax Assessment Total Assessment is a certain percentage of the fair market value that is determined by local assessors to be the total taxable value of land and additions on the property. | Land | Improvement |
|---|---|---|---|---|
| 2025 | $4,505 | $144,100 | $0 | $0 |
| 2024 | $4,505 | $129,000 | $0 | $0 |
| 2023 | $4,306 | $115,200 | $0 | $0 |
| 2022 | $4,418 | $90,900 | $0 | $0 |
| 2021 | $4,463 | $79,800 | $0 | $0 |
| 2020 | $1,563 | $70,200 | $0 | $0 |
| 2019 | $2,530 | $55,900 | $0 | $0 |
| 2018 | $3,156 | $49,500 | $0 | $0 |
| 2017 | $1,612 | $41,900 | $0 | $0 |
| 2016 | $2,147 | $38,000 | $0 | $0 |
| 2015 | $2,648 | $38,000 | $0 | $0 |
| 2013 | -- | $33,400 | $0 | $0 |
Source: Public Records
Map
Nearby Homes
- 1005 Jackson St NW Unit 1007
- 1001 Lake Michigan Dr NW
- 1015 California St NW
- 940 Lake Michigan Dr NW
- 1016 California St NW
- 945 Veto St NW
- 855 Chatham St NW
- 1209 California St NW
- 842 California St NW
- 343 Garfield Ave NW
- 800 Douglas St NW
- 914 Fulton St W
- 1153 Bridge St NW
- 854 First St NW
- 935 Watson St SW
- 539 Pine Ave NW
- 1009 Second St NW
- 26 Valley Ave SW
- 226 Sunset Ave NW
- 853 Second St NW
- 1015 Sibley St NW
- 205 Lane Ave NW
- 209 Lane Ave NW
- 201 Lane Ave NW
- 1019 Sibley St NW
- 1004 Jackson St NW
- 1004 Jackson St NW Unit 1008
- 1012 Jackson St NW
- 1000 Jackson St NW
- 1000 Jackson St NW Unit 1002
- 157 Lane Ave NW
- 206 Pine Ave NW
- 210 Pine Ave NW
- 1018 Jackson St NW
- 216 Pine Ave NW
- 1016 Sibley St NW
- 149 Lane Ave NW
- 149 Lane Ave NW Unit 153
- 149 Lane Ave NW Unit 157
- 1024 Jackson St NW