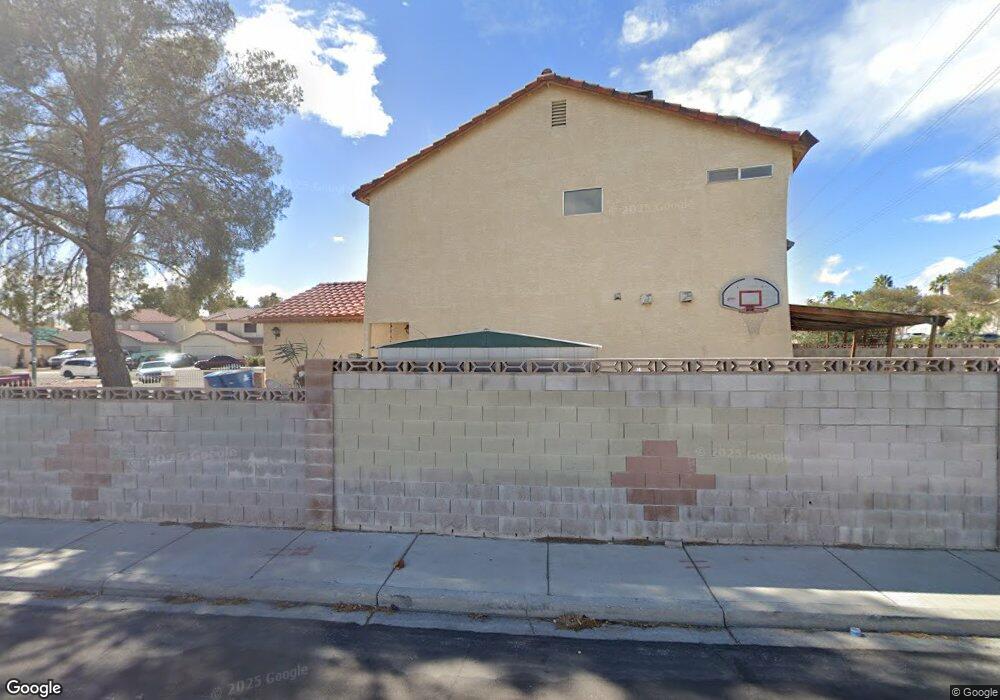
1009 Spire Canyon Rd Las Vegas, NV 89128
Angel Park NeighborhoodEstimated Value: $396,000 - $426,000
4
Beds
3
Baths
1,450
Sq Ft
$280/Sq Ft
Est. Value
About This Home
This home is located at 1009 Spire Canyon Rd, Las Vegas, NV 89128 and is currently estimated at $406,116, approximately $280 per square foot. 1009 Spire Canyon Rd is a home located in Clark County with nearby schools including James B. McMillan Elementary School, Edythe & Lloyd Katz Elementary School, and Walter Johnson Junior High School Academy of International Studies.
Ownership History
Date
Name
Owned For
Owner Type
Purchase Details
Closed on
Nov 12, 2005
Sold by
Lucas Dolores B and Filomeno Jesus
Bought by
Filomeno Jesus and Filomeno Mary Ann
Current Estimated Value
Purchase Details
Closed on
Jul 19, 2001
Sold by
Chestnut Bette L and Lovell Veda E
Bought by
Lucas Dolores B and Filmeno Jesus
Home Financials for this Owner
Home Financials are based on the most recent Mortgage that was taken out on this home.
Original Mortgage
$136,852
Interest Rate
7.09%
Mortgage Type
FHA
Purchase Details
Closed on
May 13, 1998
Sold by
Nunag Nestor B and Nunag Hidelisa S
Bought by
Chestnut Bette L and Lovell Veda E
Home Financials for this Owner
Home Financials are based on the most recent Mortgage that was taken out on this home.
Original Mortgage
$112,066
Interest Rate
7.13%
Mortgage Type
FHA
Create a Home Valuation Report for This Property
The Home Valuation Report is an in-depth analysis detailing your home's value as well as a comparison with similar homes in the area
Home Values in the Area
Average Home Value in this Area
Purchase History
| Date | Buyer | Sale Price | Title Company |
|---|---|---|---|
| Filomeno Jesus | -- | -- | |
| Lucas Dolores B | $139,000 | Fidelity National Title | |
| Chestnut Bette L | $114,000 | Old Republic Title Company |
Source: Public Records
Mortgage History
| Date | Status | Borrower | Loan Amount |
|---|---|---|---|
| Previous Owner | Lucas Dolores B | $136,852 | |
| Previous Owner | Chestnut Bette L | $112,066 |
Source: Public Records
Tax History Compared to Growth
Tax History
| Year | Tax Paid | Tax Assessment Tax Assessment Total Assessment is a certain percentage of the fair market value that is determined by local assessors to be the total taxable value of land and additions on the property. | Land | Improvement |
|---|---|---|---|---|
| 2025 | $1,282 | $69,081 | $31,150 | $37,931 |
| 2024 | $1,245 | $69,081 | $31,150 | $37,931 |
| 2023 | $1,016 | $64,581 | $28,000 | $36,581 |
| 2022 | $1,209 | $56,097 | $22,400 | $33,697 |
| 2021 | $1,174 | $52,655 | $20,300 | $32,355 |
| 2020 | $1,137 | $51,616 | $19,250 | $32,366 |
| 2019 | $1,104 | $47,174 | $15,050 | $32,124 |
| 2018 | $1,072 | $44,595 | $13,650 | $30,945 |
| 2017 | $1,446 | $44,071 | $12,600 | $31,471 |
| 2016 | $1,016 | $41,755 | $9,800 | $31,955 |
| 2015 | $1,013 | $39,758 | $8,050 | $31,708 |
| 2014 | $983 | $33,923 | $5,075 | $28,848 |
Source: Public Records
Map
Nearby Homes
- 7917 Leavorite Dr
- 7904 Copper Canyon Rd
- 1009 Sulphur Springs Ln Unit 102
- 1105 Sulphur Springs Ln Unit 102
- 929 Rockview Dr Unit 202
- 1113 Sulphur Springs Ln Unit 202
- 1013 Falconhead Ln Unit 202
- 904 Boulder Springs Dr Unit 102
- 1201 Sulphur Springs Ln Unit 101
- 900 Boulder Springs Dr Unit 101
- 921 Sulphur Springs Ln Unit 201
- 1104 Pinto Rock Ln Unit 101
- 7908 Esterbrook Way Unit 101
- 936 Boulder Mesa Dr Unit 201
- 7948 Calico Vista Blvd Unit 101
- 913 Sulphur Springs Ln Unit 202
- 1300 Pinto Rock Ln Unit 201
- 7720 Leavorite Dr
- 925 Boulder Mesa Dr Unit 102
- 1316 Pinto Rock Ln Unit 202
- 1005 Spire Canyon Rd
- 1005 Spire Canyon Rd Unit n/a
- 1001 Spire Canyon Rd
- 7932 Copper Canyon Rd
- 7928 Copper Canyon Rd
- 7921 Leavorite Dr
- 7949 Copper Canyon Rd
- 7945 Copper Canyon Rd
- 7924 Copper Canyon Rd
- 7941 Copper Canyon Rd
- 7937 Copper Canyon Rd
- 937 Sulphur Spgs Ln Unit 102
- 937 Sulphur Spgs Ln Unit 101
- 937 Sulphur Spgs Ln Unit 201
- 937 Sulphur Spgs Ln Unit 202
- 937 Sulphur Springs Ln Unit 102
- 937 Sulphur Springs Ln Unit 202
- 1001 Sulphur Springs Ln Unit 101
- 1001 Sulphur Springs Ln Unit 102
- 1001 Sulphur Springs Ln Unit 201