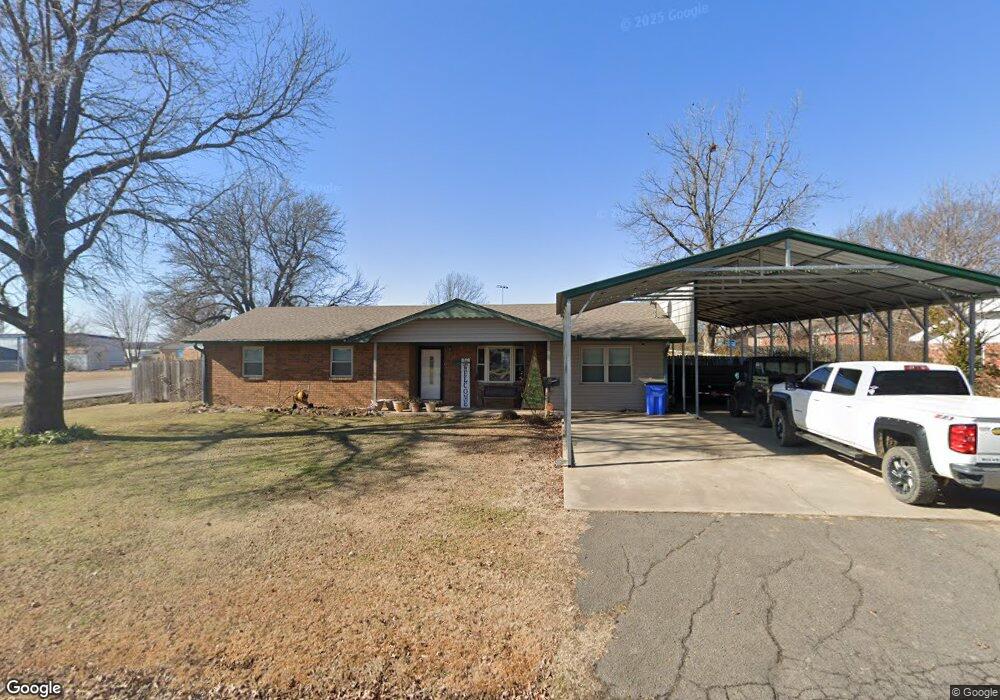
1009 SW 4th St Checotah, OK 74426
Estimated Value: $146,000 - $216,000
2
Beds
2
Baths
1,330
Sq Ft
$126/Sq Ft
Est. Value
About This Home
This home is located at 1009 SW 4th St, Checotah, OK 74426 and is currently estimated at $167,444, approximately $125 per square foot. 1009 SW 4th St is a home located in McIntosh County with nearby schools including Marshall Elementary School, Checotah Intermediate Elementary School, and Checotah Middle School.
Ownership History
Date
Name
Owned For
Owner Type
Purchase Details
Closed on
Jan 6, 2015
Sold by
Durrett Justin and Durrett Brittany Mae
Bought by
Cure Marvin E and Ginn Charles A
Current Estimated Value
Home Financials for this Owner
Home Financials are based on the most recent Mortgage that was taken out on this home.
Original Mortgage
$90,250
Outstanding Balance
$69,356
Interest Rate
3.93%
Mortgage Type
New Conventional
Estimated Equity
$98,088
Purchase Details
Closed on
Jan 23, 2014
Sold by
Durrett Justin and Durrett Gail
Bought by
Durrett Justin
Purchase Details
Closed on
Oct 18, 2007
Sold by
Long Tessa J
Bought by
Durrett Justin and Durrett Gail
Home Financials for this Owner
Home Financials are based on the most recent Mortgage that was taken out on this home.
Original Mortgage
$93,532
Interest Rate
6.37%
Mortgage Type
FHA
Purchase Details
Closed on
Nov 9, 2001
Sold by
Barton
Bought by
Long
Purchase Details
Closed on
Mar 26, 1999
Sold by
Kindred and Brewer
Bought by
Barton
Create a Home Valuation Report for This Property
The Home Valuation Report is an in-depth analysis detailing your home's value as well as a comparison with similar homes in the area
Home Values in the Area
Average Home Value in this Area
Purchase History
| Date | Buyer | Sale Price | Title Company |
|---|---|---|---|
| Cure Marvin E | $95,000 | None Available | |
| Durrett Justin | -- | -- | |
| Durrett Justin | $95,000 | None Available | |
| Long | $58,000 | -- | |
| Barton | $58,000 | -- |
Source: Public Records
Mortgage History
| Date | Status | Borrower | Loan Amount |
|---|---|---|---|
| Open | Cure Marvin E | $90,250 | |
| Previous Owner | Durrett Justin | $93,532 |
Source: Public Records
Tax History Compared to Growth
Tax History
| Year | Tax Paid | Tax Assessment Tax Assessment Total Assessment is a certain percentage of the fair market value that is determined by local assessors to be the total taxable value of land and additions on the property. | Land | Improvement |
|---|---|---|---|---|
| 2024 | $992 | $11,987 | $793 | $11,194 |
| 2023 | $992 | $10,962 | $793 | $10,169 |
| 2022 | $899 | $10,440 | $793 | $9,647 |
| 2021 | $1,016 | $10,708 | $793 | $9,915 |
| 2020 | $1,024 | $10,643 | $718 | $9,925 |
| 2019 | $1,017 | $10,643 | $718 | $9,925 |
| 2018 | $1,010 | $10,643 | $718 | $9,925 |
| 2017 | $1,003 | $10,643 | $718 | $9,925 |
| 2016 | $1,026 | $10,643 | $718 | $9,925 |
| 2015 | $891 | $9,232 | $718 | $8,514 |
| 2014 | $888 | $9,232 | $718 | $8,514 |
Source: Public Records
Map
Nearby Homes
- 1045 W Mcintosh Ave
- 504 SW 1st St
- 410 SW 3rd St
- 508 Kimberly Dr
- 514 SE Main St
- 1130 White Stag Ave
- 0 Paul Carr Dr Unit 2524865
- 0 SE Main St
- 220 E Audd Ave
- 310 E Audd Ave
- 0 S 4202 Rd Unit 2518287
- 112580 New Texanna Rd
- 513 N Wineblood St
- 705 NW 8th St
- 605 N Wineblood St
- 737 NW 4th St
- 613 N Wineblood St
- 0 W North Ave
- 825 NW 8th St
- 424398 Texanna Rd
- 1007 SW 4th St
- 520 Owens Ave
- 401 Owens Ave
- 224 Duncan Ave
- 1005 SW 4th St
- 400 Owens Ave
- 222 Duncan Ave
- 1025 Checotah Rt 4
- 225 Duncan Ave
- 1003 SW 4th St
- 223 Duncan Ave
- 1001 SW 4th St
- 224 Miles Ave
- 221 Duncan Ave
- 218 Duncan Ave
- 222 Miles Ave
- 219 Duncan Ave
- 1042 Checotah Rt 4
- 220 Miles Ave
- 216 Duncan Ave