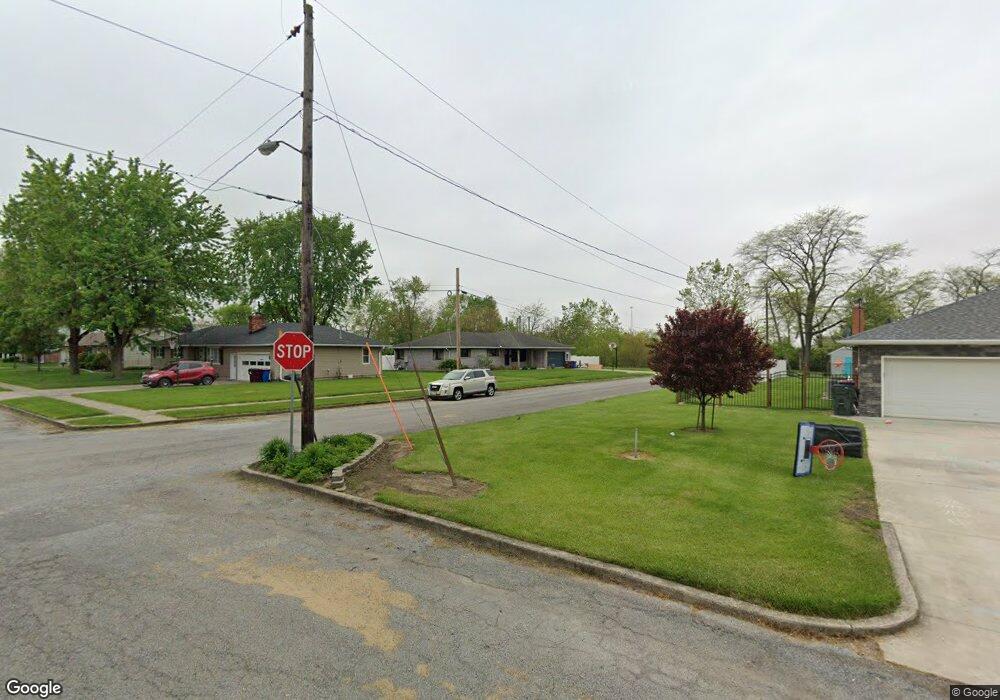
1009 W 2nd St Delphos, OH 45833
Estimated Value: $102,000 - $238,035
4
Beds
2
Baths
1,830
Sq Ft
$107/Sq Ft
Est. Value
About This Home
This home is located at 1009 W 2nd St, Delphos, OH 45833 and is currently estimated at $195,509, approximately $106 per square foot. 1009 W 2nd St is a home located in Van Wert County with nearby schools including Delphos St. John's Elementary School.
Ownership History
Date
Name
Owned For
Owner Type
Purchase Details
Closed on
Feb 28, 2025
Sold by
Hommel Mitchell L and Hommel Elizabeth A
Bought by
Looser Gerald S and Looser Mary E
Current Estimated Value
Purchase Details
Closed on
May 26, 2020
Sold by
Looser Gerald S and Looser Mary E
Bought by
Hommel Mitchell L and Hommel Elizabeth A
Home Financials for this Owner
Home Financials are based on the most recent Mortgage that was taken out on this home.
Original Mortgage
$101,200
Interest Rate
3.3%
Mortgage Type
New Conventional
Purchase Details
Closed on
Sep 16, 2016
Sold by
Gunter William L
Bought by
Looser Gerald S and Looser Mary E
Home Financials for this Owner
Home Financials are based on the most recent Mortgage that was taken out on this home.
Original Mortgage
$103,200
Interest Rate
3.43%
Mortgage Type
New Conventional
Purchase Details
Closed on
Jan 12, 2011
Sold by
Estate Of William L Gunter Sr
Bought by
Gunter Virginia P
Purchase Details
Closed on
Nov 4, 2010
Sold by
Estate Of William L Gunter Sr
Bought by
Gunter Virginia P
Create a Home Valuation Report for This Property
The Home Valuation Report is an in-depth analysis detailing your home's value as well as a comparison with similar homes in the area
Home Values in the Area
Average Home Value in this Area
Purchase History
| Date | Buyer | Sale Price | Title Company |
|---|---|---|---|
| Looser Gerald S | $100,000 | American Legacy Title | |
| Hommel Mitchell L | $122,500 | None Available | |
| Looser Gerald S | $129,000 | Attorney | |
| Gunter Virginia P | -- | None Available | |
| Gunter Virginia P | -- | None Available |
Source: Public Records
Mortgage History
| Date | Status | Borrower | Loan Amount |
|---|---|---|---|
| Previous Owner | Hommel Mitchell L | $101,200 | |
| Previous Owner | Looser Gerald S | $103,200 |
Source: Public Records
Tax History Compared to Growth
Tax History
| Year | Tax Paid | Tax Assessment Tax Assessment Total Assessment is a certain percentage of the fair market value that is determined by local assessors to be the total taxable value of land and additions on the property. | Land | Improvement |
|---|---|---|---|---|
| 2024 | $1,810 | $64,450 | $8,610 | $55,840 |
| 2023 | $1,810 | $64,450 | $8,610 | $55,840 |
| 2022 | $1,294 | $42,030 | $6,600 | $35,430 |
| 2021 | $1,298 | $42,030 | $6,600 | $35,430 |
| 2020 | $1,334 | $42,030 | $6,600 | $35,430 |
| 2019 | $1,041 | $36,360 | $6,600 | $29,760 |
| 2018 | $1,046 | $36,360 | $6,600 | $29,760 |
| 2017 | $1,049 | $36,360 | $6,600 | $29,760 |
| 2016 | $679 | $32,660 | $6,600 | $26,060 |
| 2015 | $679 | $32,660 | $6,600 | $26,060 |
| 2014 | $713 | $32,660 | $6,600 | $26,060 |
| 2013 | $760 | $32,660 | $6,600 | $26,060 |
Source: Public Records
Map
Nearby Homes
- 409 N Bredeick St
- 616 W 5th St
- 604 W 6th St
- 503 W 6th St
- 606 S Cass St
- 634 S Clay St
- 221 S Main St
- 424 S Canal St
- 210 E 3rd St
- 516 S Main St
- 405 N Franklin St
- 610 N Washington St
- 508 S Washington St
- 704 N Franklin St
- 827 S Washington St
- 810 N Franklin St
- 628 N Pierce St
- 11630 Clearview Dr
- 633 E 2nd St
- 650 E 6th St