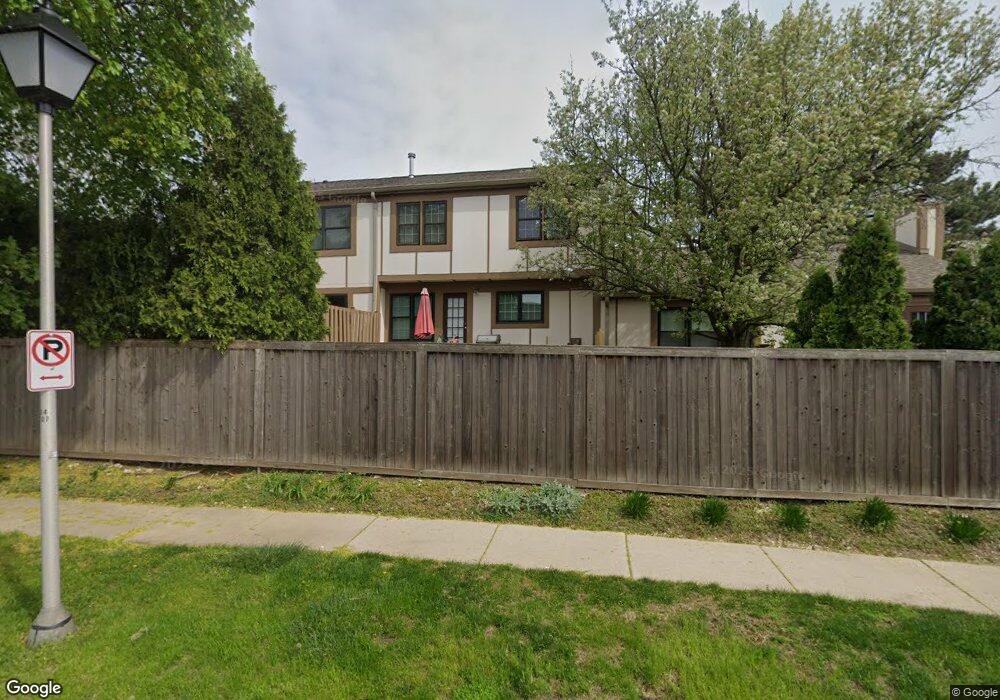
1009 Wheaton Oaks Dr Unit C Wheaton, IL 60187
Jewell Road NeighborhoodEstimated Value: $409,976 - $532,000
3
Beds
3
Baths
1,820
Sq Ft
$249/Sq Ft
Est. Value
About This Home
This home is located at 1009 Wheaton Oaks Dr Unit C, Wheaton, IL 60187 and is currently estimated at $453,994, approximately $249 per square foot. 1009 Wheaton Oaks Dr Unit C is a home located in DuPage County with nearby schools including Carl Sandburg Elementary School, Monroe Middle School, and Wheaton North High School.
Ownership History
Date
Name
Owned For
Owner Type
Purchase Details
Closed on
Jul 22, 1997
Sold by
Hutchcroft Marion K
Bought by
Hutchcroft Marian Kay and Marian Kay Hutchcroft Trust
Current Estimated Value
Purchase Details
Closed on
Jul 1, 1996
Sold by
Reed Trudy
Bought by
Hutchcroft Marian K
Home Financials for this Owner
Home Financials are based on the most recent Mortgage that was taken out on this home.
Original Mortgage
$99,000
Outstanding Balance
$7,049
Interest Rate
8.07%
Estimated Equity
$446,945
Purchase Details
Closed on
Aug 20, 1993
Sold by
Podvin Margaret J and Dykema Margaret J
Bought by
Reed Trudy
Home Financials for this Owner
Home Financials are based on the most recent Mortgage that was taken out on this home.
Original Mortgage
$116,000
Interest Rate
7.05%
Create a Home Valuation Report for This Property
The Home Valuation Report is an in-depth analysis detailing your home's value as well as a comparison with similar homes in the area
Home Values in the Area
Average Home Value in this Area
Purchase History
| Date | Buyer | Sale Price | Title Company |
|---|---|---|---|
| Hutchcroft Marian Kay | -- | -- | |
| Hutchcroft Marian K | $214,000 | -- | |
| Reed Trudy | $145,000 | -- |
Source: Public Records
Mortgage History
| Date | Status | Borrower | Loan Amount |
|---|---|---|---|
| Open | Hutchcroft Marian K | $99,000 | |
| Previous Owner | Reed Trudy | $116,000 |
Source: Public Records
Tax History
| Year | Tax Paid | Tax Assessment Tax Assessment Total Assessment is a certain percentage of the fair market value that is determined by local assessors to be the total taxable value of land and additions on the property. | Land | Improvement |
|---|---|---|---|---|
| 2024 | $6,406 | $115,387 | $19,273 | $96,114 |
| 2023 | $6,096 | $106,210 | $17,740 | $88,470 |
| 2022 | $5,041 | $83,790 | $16,770 | $67,020 |
| 2021 | $5,011 | $81,800 | $16,370 | $65,430 |
| 2020 | $4,990 | $81,040 | $16,220 | $64,820 |
| 2019 | $4,861 | $78,900 | $15,790 | $63,110 |
| 2018 | $4,935 | $79,140 | $14,880 | $64,260 |
| 2017 | $4,840 | $76,220 | $14,330 | $61,890 |
| 2016 | $4,753 | $73,180 | $13,760 | $59,420 |
| 2015 | $4,688 | $69,820 | $13,130 | $56,690 |
| 2014 | $5,736 | $81,740 | $15,370 | $66,370 |
| 2013 | $5,590 | $81,990 | $15,420 | $66,570 |
Source: Public Records
Map
Nearby Homes
- 570 Amy Ln
- 0N105 Lot 1 Nepil Ave
- 0N105 Lot 2 Nepil Ave
- 114 W Prairie Ave
- 1115 N Main St
- 0 Ellis Ave
- 26W181 Grand Ave
- n 071 Stanley St
- 107 N Pierce Ave
- 0N049 Page St
- 455 W Front St Unit 2208
- 100 N Gary Ave Unit 208
- 405 W Front St Unit 3207
- 340 Parkway Dr
- 312 E Lincoln Ave
- 833 Parkside Dr
- Lot 11 Ellis Ave
- 425 Wakeman Ave
- 1902 N Washington St
- 25W275 Doris Ave
- 1013 Wheaton Oaks Dr
- 1005 Wheaton Oaks Dr
- 1001 Wheaton Oaks Dr Unit E
- 1017 Wheaton Oaks Dr
- 1033 Wheaton Oaks Dr
- 949 Wheaton Oaks Dr Unit F
- 949 Wheaton Oaks Dr Unit 949
- 945 Wheaton Oaks Dr
- 1037 Wheaton Oaks Dr
- 941 Wheaton Oaks Dr Unit H
- 1010 Wheaton Oaks Dr Unit B
- 1008 Wheaton Oaks Dr Unit C
- 1041 Wheaton Oaks Dr Unit C
- 1006 Wheaton Oaks Dr Unit D
- 937 Wheaton Oaks Dr Unit 1
- 1045 Wheaton Oaks Dr
- 1045 Wheaton Oaks Dr Unit B
- 954 Wheaton Oaks Dr
- 950 Wheaton Oaks Dr
- 933 Wheaton Oaks Dr
Your Personal Tour Guide
Ask me questions while you tour the home.