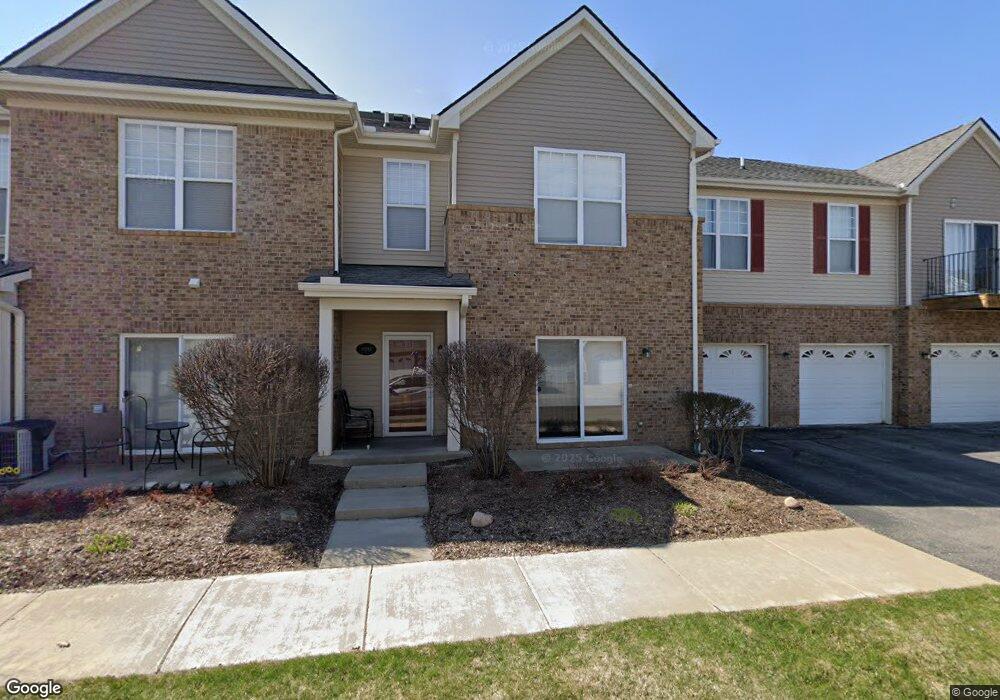
10098 Ridge Run St Unit 3, 31 Howell, MI 48855
Estimated Value: $259,000 - $293,000
2
Beds
3
Baths
1,508
Sq Ft
$180/Sq Ft
Est. Value
About This Home
This home is located at 10098 Ridge Run St Unit 3, 31, Howell, MI 48855 and is currently estimated at $271,542, approximately $180 per square foot. 10098 Ridge Run St Unit 3, 31 is a home located in Livingston County with nearby schools including Hartland High School, Charyl Stockwell Academy, and Our Savior Evangelical Lutheran School.
Ownership History
Date
Name
Owned For
Owner Type
Purchase Details
Closed on
May 11, 2020
Sold by
Webb Denna A
Bought by
Hertmann Kenneth
Current Estimated Value
Home Financials for this Owner
Home Financials are based on the most recent Mortgage that was taken out on this home.
Original Mortgage
$168,150
Outstanding Balance
$149,004
Interest Rate
3.3%
Mortgage Type
New Conventional
Estimated Equity
$122,538
Purchase Details
Closed on
Dec 9, 2011
Sold by
Mjc Building Services Inc
Bought by
Webb Denna A
Purchase Details
Closed on
Nov 30, 2011
Sold by
Fifth Third Bank
Bought by
Mjc Building Services Inc
Create a Home Valuation Report for This Property
The Home Valuation Report is an in-depth analysis detailing your home's value as well as a comparison with similar homes in the area
Home Values in the Area
Average Home Value in this Area
Purchase History
| Date | Buyer | Sale Price | Title Company |
|---|---|---|---|
| Hertmann Kenneth | $177,000 | Liberty Title | |
| Webb Denna A | $85,000 | -- | |
| Mjc Building Services Inc | -- | -- |
Source: Public Records
Mortgage History
| Date | Status | Borrower | Loan Amount |
|---|---|---|---|
| Open | Hertmann Kenneth | $168,150 |
Source: Public Records
Tax History Compared to Growth
Tax History
| Year | Tax Paid | Tax Assessment Tax Assessment Total Assessment is a certain percentage of the fair market value that is determined by local assessors to be the total taxable value of land and additions on the property. | Land | Improvement |
|---|---|---|---|---|
| 2025 | $1,194 | $120,100 | $0 | $0 |
| 2024 | $1,161 | $117,800 | $0 | $0 |
| 2023 | $1,110 | $94,500 | $0 | $0 |
| 2022 | $2,434 | $82,600 | $0 | $0 |
| 2021 | $2,116 | $88,800 | $0 | $0 |
| 2020 | $1,680 | $98,400 | $0 | $0 |
| 2019 | $1,584 | $82,600 | $0 | $0 |
| 2018 | $1,556 | $75,000 | $0 | $0 |
| 2017 | $1,550 | $75,000 | $0 | $0 |
| 2016 | $1,549 | $68,600 | $0 | $0 |
| 2014 | $2,018 | $50,800 | $0 | $0 |
| 2012 | $2,018 | $47,300 | $0 | $0 |
Source: Public Records
Map
Nearby Homes
- 10028 Ridge Run St Unit 10
- Beretta Loft Plan at Hunters Ridge - Condominiums
- Beretta Plan at Hunters Ridge - Condominiums
- Arrow Plan at Hunters Ridge - Condominiums
- Chase Plan at Hunters Ridge - Condominiums
- 9920 Crossview Trail Unit 89
- 9960 Ridge Run St
- 2215 Chase Dr Unit 102
- 2215 Chase Dr
- 2209 Chase Dr Unit 101
- 9947 Ridge Run St Unit 89/9
- 2280 Chase Dr Unit 110
- 2221 Chase Dr Unit 103
- 2260 Chase Dr Unit 115
- 2245 Chase Dr
- 2221 Chase Dr
- 2250 Chase Dr Unit 117
- 2270 Chase Dr Unit 112
- 2249 Chase Dr Unit 108
- 2270 Chase Dr
- 10098 Ridge Run St
- 10098 Ridge Run St Unit 31
- 10090 Ridge Run St
- 10106 Ridge Run St
- 10106 Ridge Run St Unit 132
- 10094 Ridge Run St Unit 35
- 10094 Ridge Run St
- 10094 Ridge Run St Unit 3, 35
- 10102 Ridge Run St Unit 3 34
- 10102 Ridge Run St
- 10102 Ridge Run St Unit 34
- 10086 Ridge Run St Unit 3 36
- 10086 Ridge Run St
- 10110 Ridge Run St
- 10110 Ridge Run St Unit 27
- 10122 Ridge Run St
- 10114 Ridge Run St Unit 29
- 10114 Ridge Run St
- 10114 Ridge Run St Unit 3 29
- 10118 Ridge Run St