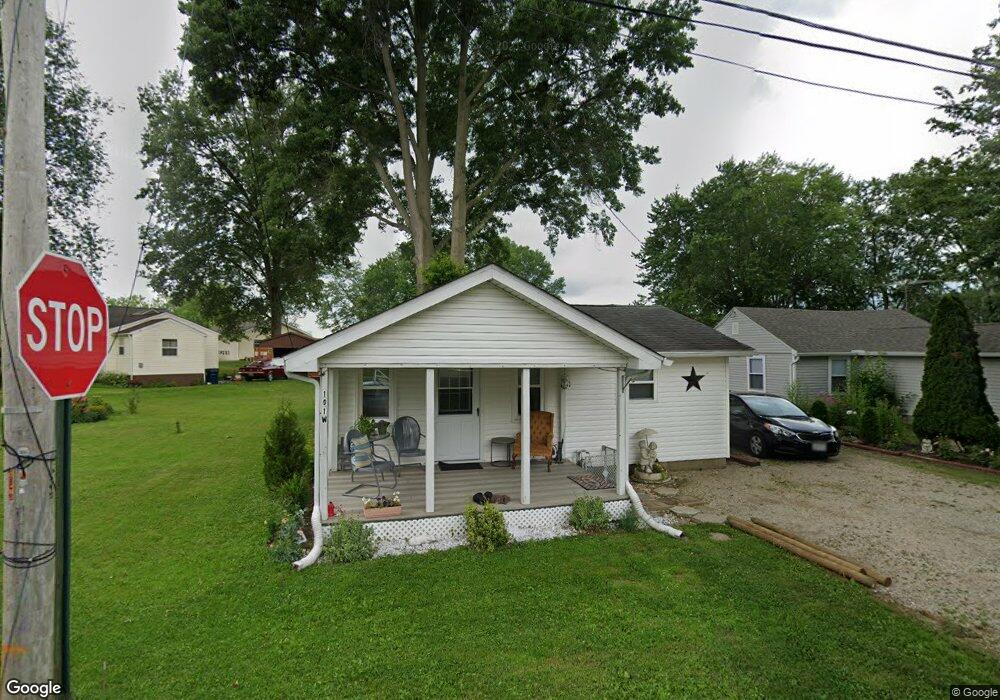
101 1st Ave Hebron, OH 43025
Estimated Value: $163,000 - $431,000
3
Beds
3
Baths
1,870
Sq Ft
$147/Sq Ft
Est. Value
About This Home
This home is located at 101 1st Ave, Hebron, OH 43025 and is currently estimated at $274,375, approximately $146 per square foot. 101 1st Ave is a home located in Licking County with nearby schools including Jackson Intermediate School, Lakewood Middle School, and Lakewood High School.
Ownership History
Date
Name
Owned For
Owner Type
Purchase Details
Closed on
Dec 4, 2018
Sold by
Pnc Mortgage
Bought by
Sherman Karen T and Sherman Merle F
Current Estimated Value
Home Financials for this Owner
Home Financials are based on the most recent Mortgage that was taken out on this home.
Original Mortgage
$82,000
Outstanding Balance
$71,243
Interest Rate
4.8%
Mortgage Type
New Conventional
Estimated Equity
$203,132
Purchase Details
Closed on
Nov 15, 2017
Sold by
Rill Candice Anne A and Rill Candice Anne Alene
Bought by
Pnc Bank National Assn
Purchase Details
Closed on
Mar 29, 2013
Sold by
Hayes Kimberly A
Bought by
Rill Candice Anne A and Rill Michael
Home Financials for this Owner
Home Financials are based on the most recent Mortgage that was taken out on this home.
Original Mortgage
$106,043
Interest Rate
3.48%
Mortgage Type
FHA
Purchase Details
Closed on
Jan 18, 2005
Sold by
Hayes Kimberly A and Hayes Billie J
Bought by
Hayes Billie J and Hayes Kimberly A
Create a Home Valuation Report for This Property
The Home Valuation Report is an in-depth analysis detailing your home's value as well as a comparison with similar homes in the area
Home Values in the Area
Average Home Value in this Area
Purchase History
We collect this data history from publicly available records. To have your information removed, we recommend requesting removal directly through your county’s website.
| Date | Buyer | Sale Price | Title Company |
|---|---|---|---|
| Sherman Karen T | $112,000 | Nationallink Reo | |
| Pnc Bank National Assn | $60,000 | None Available | |
| Rill Candice Anne A | $108,000 | None Available | |
| Hayes Billie J | -- | Ambassador Title |
Source: Public Records
Mortgage History
We collect this data history from publicly available records. To have your information removed, we recommend requesting removal directly through your county’s website.
| Date | Status | Borrower | Loan Amount |
|---|---|---|---|
| Open | Sherman Karen T | $82,000 | |
| Previous Owner | Rill Candice Anne A | $106,043 |
Source: Public Records
Tax History
| Year | Tax Paid | Tax Assessment Tax Assessment Total Assessment is a certain percentage of the fair market value that is determined by local assessors to be the total taxable value of land and additions on the property. | Land | Improvement |
|---|---|---|---|---|
| 2025 | $2,097 | $59,780 | $17,220 | $42,560 |
| 2024 | $1,969 | $59,780 | $17,220 | $42,560 |
| 2023 | $1,979 | $59,780 | $17,220 | $42,560 |
| 2022 | $1,972 | $52,920 | $8,610 | $44,310 |
| 2021 | $1,960 | $52,920 | $8,610 | $44,310 |
| 2020 | $2,024 | $52,920 | $8,610 | $44,310 |
| 2019 | $2,248 | $40,250 | $8,610 | $31,640 |
| 2018 | $2,270 | $0 | $0 | $0 |
| 2017 | $1,921 | $0 | $0 | $0 |
| 2016 | $1,740 | $0 | $0 | $0 |
| 2015 | $1,683 | $0 | $0 | $0 |
| 2014 | $2,620 | $0 | $0 | $0 |
| 2013 | $1,653 | $0 | $0 | $0 |
Source: Public Records
Map
Nearby Homes
- 106 Sunset Dr
- 1138 Lake Forest Dr
- 1132 Lake Forest Dr
- 2230 Forest Ridge Dr
- 1119 Lake Forest Dr
- 119 Dennison St
- 109 Dennison St
- 113 E 2nd St
- 0 E Main St Unit 226004209
- 575 E Main St
- 107 E North St
- 814 W Main St
- 11047 Hebron Rd
- 802 Cumberland Meadows Cir
- 0 Mill Dam Rd Unit 226010656
- 206 Cumberland Meadows Cir
- 202 Cumberland Meadows Cir
- 165 Worth Dr
- 104 Cumberland Meadows Cir
- 110 Cumberland Meadows Cir
Your Personal Tour Guide
Ask me questions while you tour the home.