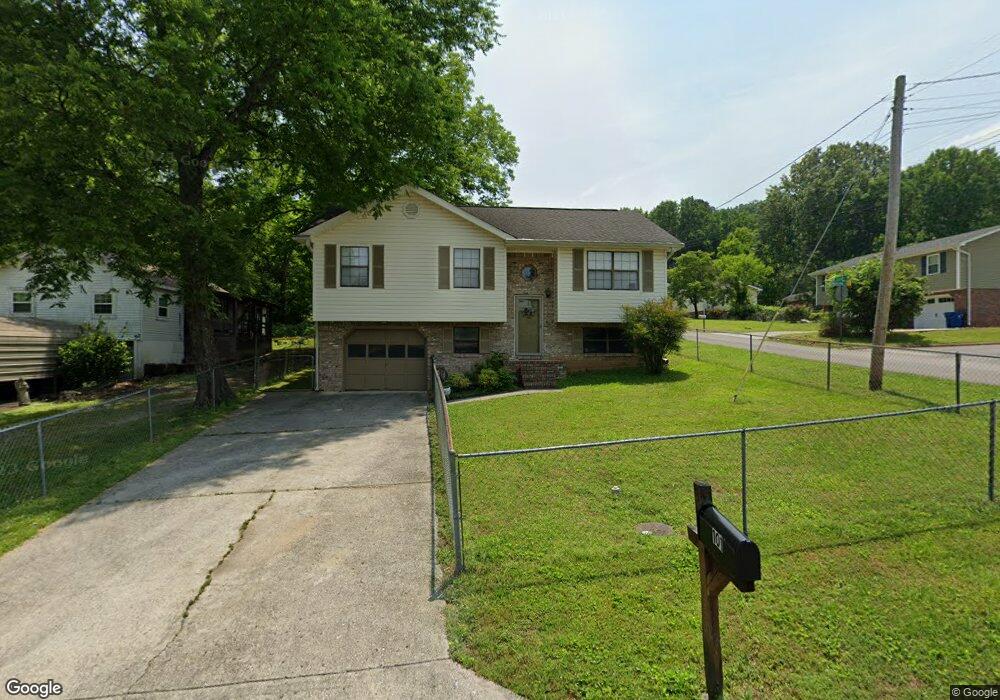
101 1st St Rossville, GA 30741
Estimated Value: $184,812 - $231,000
--
Bed
1
Bath
1,000
Sq Ft
$211/Sq Ft
Est. Value
About This Home
This home is located at 101 1st St, Rossville, GA 30741 and is currently estimated at $211,203, approximately $211 per square foot. 101 1st St is a home located in Walker County with nearby schools including Stone Creek Elementary School, Rossville Middle School, and Ridgeland High School.
Ownership History
Date
Name
Owned For
Owner Type
Purchase Details
Closed on
May 16, 2016
Sold by
Manning Glenda Sue
Bought by
Hughes Melinda Gail
Current Estimated Value
Home Financials for this Owner
Home Financials are based on the most recent Mortgage that was taken out on this home.
Original Mortgage
$70,000
Interest Rate
3.58%
Mortgage Type
New Conventional
Purchase Details
Closed on
Nov 11, 1991
Sold by
Baker & Summers Construction
Bought by
Manning Glenda Sue
Purchase Details
Closed on
Oct 2, 1990
Sold by
Morrow Jerry and Morrow Mary
Bought by
Baker & Summers Construction
Purchase Details
Closed on
Aug 15, 1984
Sold by
Ashton Jack E and Ashton Billie
Bought by
Morrow Jerry and Morrow Mary
Purchase Details
Closed on
Aug 8, 1980
Sold by
Ashton J E
Bought by
Ashton Jack E and Ashton Billie
Purchase Details
Closed on
Jan 1, 1972
Bought by
Ashton J E
Create a Home Valuation Report for This Property
The Home Valuation Report is an in-depth analysis detailing your home's value as well as a comparison with similar homes in the area
Home Values in the Area
Average Home Value in this Area
Purchase History
| Date | Buyer | Sale Price | Title Company |
|---|---|---|---|
| Hughes Melinda Gail | $74,000 | -- | |
| Manning Glenda Sue | $54,000 | -- | |
| Baker & Summers Construction | $4,000 | -- | |
| Morrow Jerry | -- | -- | |
| Ashton Jack E | -- | -- | |
| Ashton J E | -- | -- |
Source: Public Records
Mortgage History
| Date | Status | Borrower | Loan Amount |
|---|---|---|---|
| Closed | Hughes Melinda Gail | $70,000 |
Source: Public Records
Tax History Compared to Growth
Tax History
| Year | Tax Paid | Tax Assessment Tax Assessment Total Assessment is a certain percentage of the fair market value that is determined by local assessors to be the total taxable value of land and additions on the property. | Land | Improvement |
|---|---|---|---|---|
| 2024 | $1,214 | $82,417 | $2,000 | $80,417 |
| 2023 | $918 | $70,914 | $2,000 | $68,914 |
| 2022 | $1,454 | $55,222 | $2,000 | $53,222 |
| 2021 | $1,063 | $36,188 | $2,000 | $34,188 |
| 2020 | $914 | $29,788 | $2,000 | $27,788 |
| 2019 | $914 | $29,788 | $2,000 | $27,788 |
| 2018 | $886 | $29,788 | $2,000 | $27,788 |
| 2017 | $886 | $29,788 | $2,000 | $27,788 |
| 2016 | $728 | $28,394 | $2,000 | $26,394 |
| 2015 | $802 | $29,697 | $2,000 | $27,697 |
| 2014 | $772 | $29,697 | $2,000 | $27,697 |
| 2013 | -- | $29,697 | $2,000 | $27,697 |
Source: Public Records
Map
Nearby Homes
- 4 Carroll Ln
- 328 S Mission Ridge Dr
- 126 S Liner St
- 1204 Wooden Ave
- 105 Elm St
- 136 Summit St
- Lot 81 Battle Bluff Dr
- Lot 80 Battle Bluff Dr
- Lot 79 Battle Bluff Dr
- 164 S Mission Ridge Dr
- 405 Miami Ave
- 1014 Lee Ave
- 610 Union Ave
- 515 Hogan Rd
- 816 Indian Ave
- 601 James St
- 916 Logan Ave
- 200 W Oak St
- 806 Mcfarland Ave
- 189 Leinbach Rd