101 3rd St Barnesville, GA 30204
Estimated Value: $195,000 - $232,000
3
Beds
2
Baths
1,740
Sq Ft
$119/Sq Ft
Est. Value
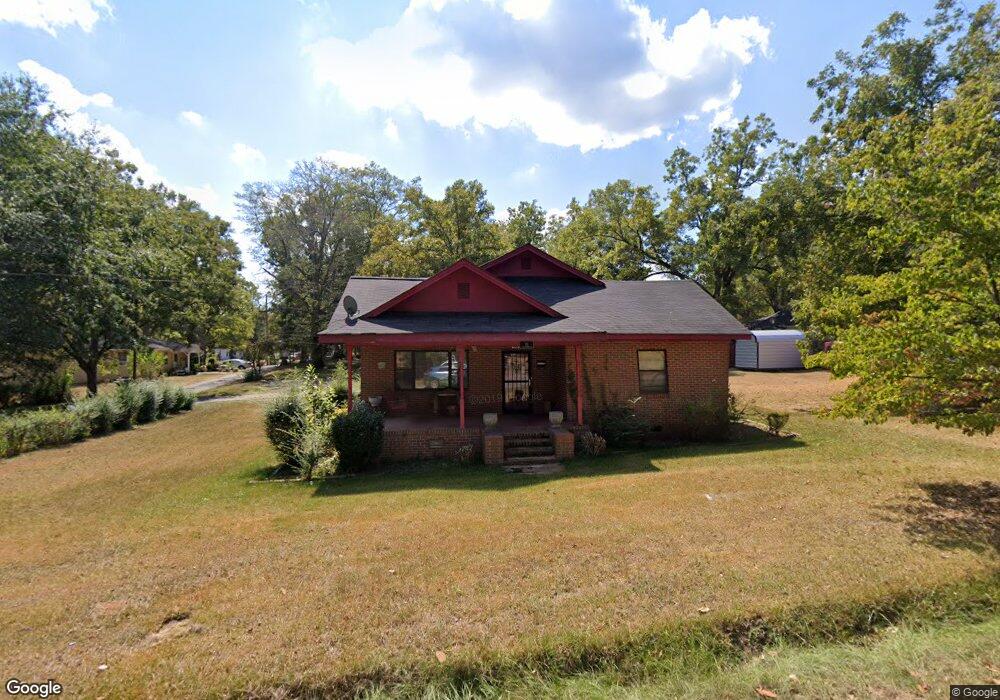
About This Home
This home is located at 101 3rd St, Barnesville, GA 30204 and is currently estimated at $207,735, approximately $119 per square foot. 101 3rd St is a home located in Lamar County with nearby schools including Lamar County Primary School, Lamar County Elementary School, and Lamar County Middle School.
Ownership History
Date
Name
Owned For
Owner Type
Purchase Details
Closed on
Dec 22, 2025
Sold by
Lowe Felisha
Bought by
Grant Mary Ann
Current Estimated Value
Home Financials for this Owner
Home Financials are based on the most recent Mortgage that was taken out on this home.
Original Mortgage
$205,000
Outstanding Balance
$204,806
Interest Rate
6.26%
Mortgage Type
VA
Estimated Equity
$2,929
Purchase Details
Closed on
Apr 30, 2021
Sold by
Cafe Real Estate Holdings And Investment
Bought by
Lowe Felisha
Home Financials for this Owner
Home Financials are based on the most recent Mortgage that was taken out on this home.
Original Mortgage
$136,262
Interest Rate
3.1%
Mortgage Type
New Conventional
Purchase Details
Closed on
Oct 16, 2020
Sold by
Abws Properties Llc
Bought by
Cafe Real Estate Holdings And Investment
Purchase Details
Closed on
Sep 1, 2020
Sold by
Executor Oneal Wanda Faye
Bought by
Abws Properties Llc
Purchase Details
Closed on
Oct 6, 2015
Sold by
Oneal Wanda Faye B
Bought by
Barrett Earnestine
Purchase Details
Closed on
May 1, 1974
Sold by
Raglin Moses
Bought by
Barrett George
Create a Home Valuation Report for This Property
The Home Valuation Report is an in-depth analysis detailing your home's value as well as a comparison with similar homes in the area
Home Values in the Area
Average Home Value in this Area
Purchase History
| Date | Buyer | Sale Price | Title Company |
|---|---|---|---|
| Grant Mary Ann | $205,000 | -- | |
| Lowe Felisha | $134,900 | -- | |
| Cafe Real Estate Holdings And Investment | $40,000 | -- | |
| Abws Properties Llc | -- | -- | |
| Barrett Earnestine | -- | -- | |
| Barrett George | -- | -- |
Source: Public Records
Mortgage History
| Date | Status | Borrower | Loan Amount |
|---|---|---|---|
| Open | Grant Mary Ann | $205,000 | |
| Previous Owner | Lowe Felisha | $136,262 |
Source: Public Records
Tax History
| Year | Tax Paid | Tax Assessment Tax Assessment Total Assessment is a certain percentage of the fair market value that is determined by local assessors to be the total taxable value of land and additions on the property. | Land | Improvement |
|---|---|---|---|---|
| 2025 | $1,726 | $76,840 | $2,400 | $74,440 |
| 2024 | $1,498 | $53,953 | $1,200 | $52,753 |
| 2023 | $1,613 | $53,953 | $1,200 | $52,753 |
| 2022 | $1,437 | $57,216 | $1,200 | $56,016 |
| 2021 | $481 | $18,252 | $1,200 | $17,052 |
| 2020 | $711 | $22,456 | $1,200 | $21,256 |
| 2019 | $914 | $28,798 | $1,200 | $27,598 |
| 2018 | $760 | $24,930 | $1,200 | $23,730 |
| 2017 | $756 | $24,930 | $1,200 | $23,730 |
| 2016 | $756 | $24,930 | $1,200 | $23,730 |
| 2015 | $486 | $24,930 | $1,200 | $23,730 |
| 2014 | $481 | $24,930 | $1,200 | $23,730 |
| 2013 | -- | $25,149 | $1,418 | $23,730 |
Source: Public Records
Map
Nearby Homes
- 107 1st St
- 250 Mill St
- 7 Jackson St
- 339 Atlanta St
- 24 Sims St
- 149 Akins St
- 149 Holmes St
- 531 Thomaston St
- 114 Stafford Ave
- 121 Westchester Dr
- 147 Stafford Ave
- 407 Westchester Dr
- 642 Greenwood St
- 13 Brown St
- 0 Roberts Rd Unit 10593586
- 0 Hannah Ct Unit LOT 13 10587187
- 0 Hannah Ct Unit LOT 10 10587183
- 0 Hannah Ct Unit LOT 14 10587190
- 275 Rose Ave
- 0 Hannah St Unit LOT 1 10587177
Your Personal Tour Guide
Ask me questions while you tour the home.