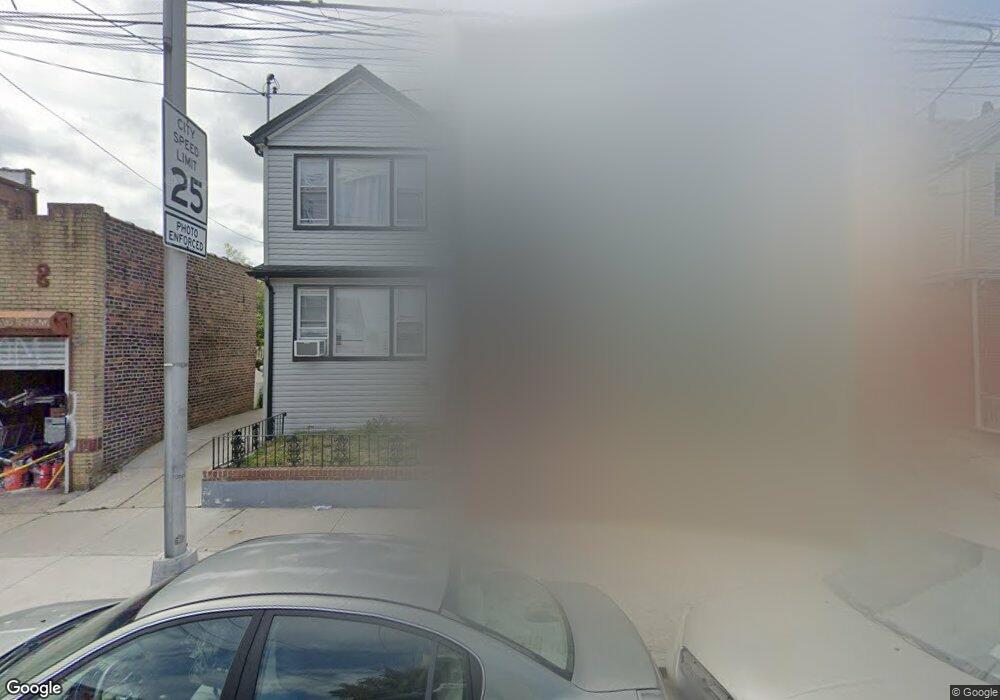
101-60 104th St Ozone Park, NY 11416
Richmond Hill NeighborhoodEstimated Value: $921,000 - $996,000
7
Beds
3
Baths
1,998
Sq Ft
$478/Sq Ft
Est. Value
About This Home
This home is located at 101-60 104th St, Ozone Park, NY 11416 and is currently estimated at $955,606, approximately $478 per square foot. 101-60 104th St is a home located in Queens County with nearby schools including P.S. 65 - The Raymond York Elementary School, Robert H. Goddard High School, and John Adams High School.
Ownership History
Date
Name
Owned For
Owner Type
Purchase Details
Closed on
Jun 11, 2021
Sold by
Maya Development Llc
Bought by
Chu Chao Wen
Current Estimated Value
Home Financials for this Owner
Home Financials are based on the most recent Mortgage that was taken out on this home.
Original Mortgage
$570,000
Outstanding Balance
$516,064
Interest Rate
2.9%
Mortgage Type
Purchase Money Mortgage
Estimated Equity
$439,542
Purchase Details
Closed on
Oct 23, 2020
Sold by
Lacey Andrew and Lacey Ethelene E
Bought by
Maya Development Llc
Home Financials for this Owner
Home Financials are based on the most recent Mortgage that was taken out on this home.
Original Mortgage
$710,000
Interest Rate
2.8%
Mortgage Type
New Conventional
Purchase Details
Closed on
Feb 8, 2008
Sold by
Cleary Stacey A and Jonason Lawrence
Bought by
Lacey Andrew and Lay Carol
Create a Home Valuation Report for This Property
The Home Valuation Report is an in-depth analysis detailing your home's value as well as a comparison with similar homes in the area
Home Values in the Area
Average Home Value in this Area
Purchase History
| Date | Buyer | Sale Price | Title Company |
|---|---|---|---|
| Chu Chao Wen | $950,000 | -- | |
| Maya Development Llc | $645,000 | -- | |
| Lacey Andrew | $225,000 | -- |
Source: Public Records
Mortgage History
| Date | Status | Borrower | Loan Amount |
|---|---|---|---|
| Open | Chu Chao Wen | $570,000 | |
| Previous Owner | Maya Development Llc | $710,000 |
Source: Public Records
Tax History Compared to Growth
Tax History
| Year | Tax Paid | Tax Assessment Tax Assessment Total Assessment is a certain percentage of the fair market value that is determined by local assessors to be the total taxable value of land and additions on the property. | Land | Improvement |
|---|---|---|---|---|
| 2025 | $7,321 | $38,635 | $9,629 | $29,006 |
| 2024 | $7,321 | $36,449 | $10,090 | $26,359 |
| 2023 | $6,907 | $34,387 | $9,118 | $25,269 |
| 2022 | $6,557 | $52,440 | $14,700 | $37,740 |
| 2021 | $6,912 | $46,260 | $14,700 | $31,560 |
| 2020 | $6,815 | $45,240 | $14,700 | $30,540 |
| 2019 | $6,354 | $40,320 | $14,700 | $25,620 |
| 2018 | $5,842 | $28,656 | $9,724 | $18,932 |
| 2017 | $5,579 | $27,370 | $11,847 | $15,523 |
| 2016 | $5,472 | $27,370 | $11,847 | $15,523 |
| 2015 | $2,895 | $26,830 | $15,899 | $10,931 |
| 2014 | $2,895 | $25,312 | $15,232 | $10,080 |
Source: Public Records
Map
Nearby Homes
- 10152 103rd St
- 103-22 104th St
- 103-18 103rd St
- 10154 102nd St
- 10208 101st Ave
- 103-37 102nd St
- 10349A 104th St
- 103-10 106th St
- 103-50 102nd St
- 100-08 101st Ave
- 10370 103rd St
- 97-56 101st St
- 105-02 Liberty Ave
- 97-25 102nd St
- 97-17 106th St
- 10805 103rd Ave
- 10417 106th St
- 10438 107th St
- 10109 97th Ave
- 95-26 107th St
- 101-60 104th St Unit 1FL
- 10160 104th St
- 10158 104th St
- 101-56 104th St Unit 1
- 101-56 104th St Unit 2 Fl
- 101-56 104th St
- 10224 104th St
- 10230 104th St
- 10156 104th St
- 10319 103rd Ave
- 10315 103rd Ave
- 10154 104th St
- 10313 103rd Ave
- 10319 103rd Ave
- 103-13 103rd Ave Unit House
- 103-13 103rd Ave
- 103-11 103rd Ave
- 10311 103rd Ave
- 10204 104th St
- 10206 104th St