T
Seller's Agent in 2025
The Modern Collective Group
Compass
(401) 744-2692
2 in this area
95 Total Sales
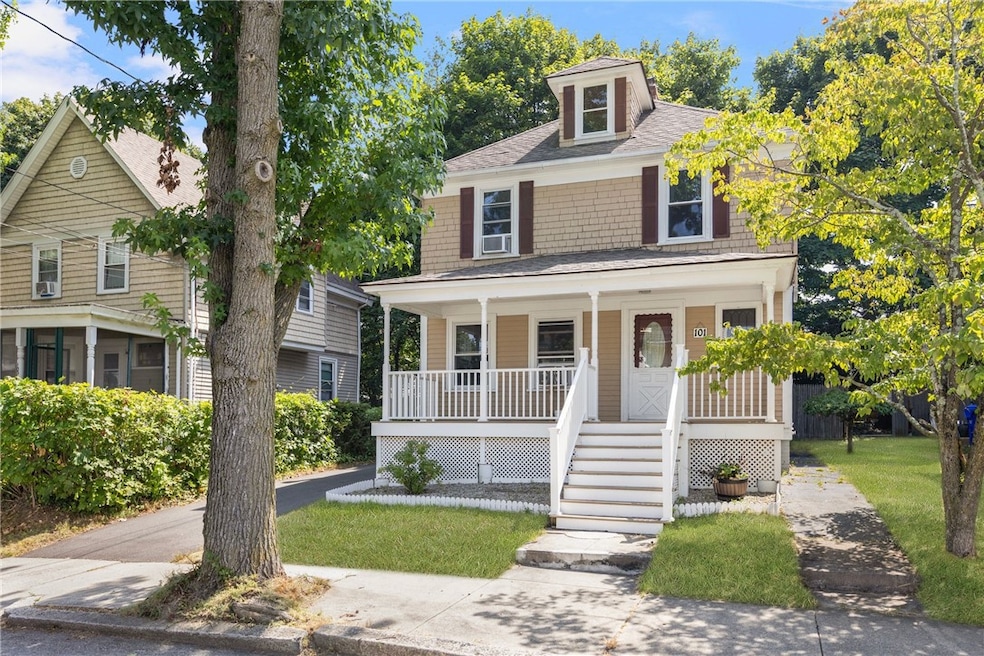
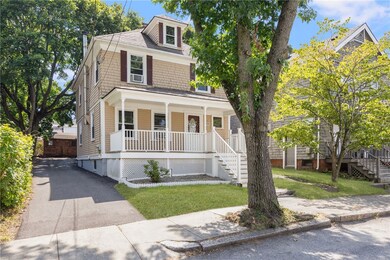
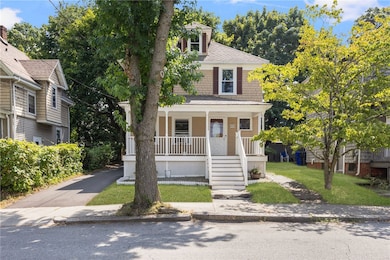
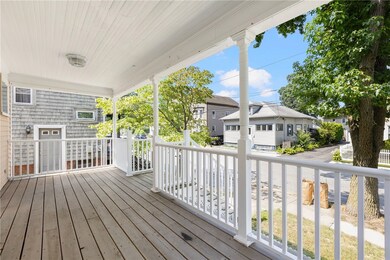
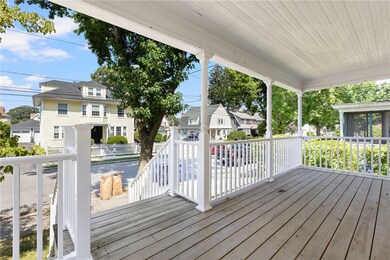
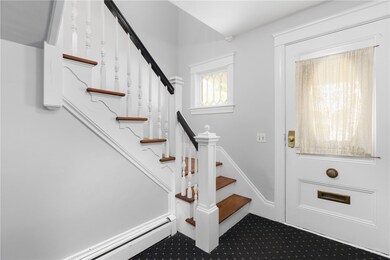
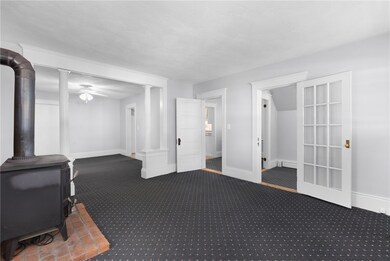
Tucked in the heart of East Providence, this 3 bed, 2 bath charmer blends classic character with thoughtful modern updates. Step inside and feel the warmth of the property's architectural details, complemented by an updated kitchen and bath that make everyday living a breeze. Yes, that's a working elevator because convenience never goes out of style. Outside, a private yard and storage shed give you room to relax, garden, or enjoy a private family function. With many updates already handled, you can move right in and start enjoying the perks of this location just minutes to Providence's vibrant dining scene, arts, and businesses, plus easy access to coastal escapes, bike paths, and local shops. All this comes at a great price point, yet with all the access and energy of city life just over two bridge options. A rare find that delivers charm, practicality, and prime location in one inviting package.
| Date | Type | Sale Price | Title Company |
|---|---|---|---|
| Deed | $213,000 | -- | |
| Deed | $239,000 | -- | |
| Deed | $213,000 | -- | |
| Deed | $239,000 | -- |
| Date | Status | Loan Amount | Loan Type |
|---|---|---|---|
| Open | $208,405 | No Value Available | |
| Closed | $209,709 | Purchase Money Mortgage | |
| Previous Owner | $191,200 | Purchase Money Mortgage |
| Date | Event | Price | Change | Sq Ft Price |
|---|---|---|---|---|
| 09/23/2025 09/23/25 | Sold | $396,000 | +4.2% | $256 / Sq Ft |
| 08/19/2025 08/19/25 | Pending | -- | -- | -- |
| 08/08/2025 08/08/25 | For Sale | $379,900 | -- | $245 / Sq Ft |
| Year | Tax Paid | Tax Assessment Tax Assessment Total Assessment is a certain percentage of the fair market value that is determined by local assessors to be the total taxable value of land and additions on the property. | Land | Improvement |
|---|---|---|---|---|
| 2024 | $4,076 | $265,900 | $73,800 | $192,100 |
| 2023 | $3,925 | $265,900 | $73,800 | $192,100 |
| 2022 | $3,854 | $176,300 | $40,100 | $136,200 |
| 2021 | $3,790 | $176,300 | $39,400 | $136,900 |
| 2020 | $3,630 | $176,300 | $39,400 | $136,900 |
| 2019 | $3,534 | $176,500 | $39,400 | $137,100 |
| 2018 | $3,453 | $150,900 | $41,100 | $109,800 |
| 2017 | $3,376 | $150,900 | $41,100 | $109,800 |
| 2016 | $3,359 | $150,900 | $41,100 | $109,800 |
| 2015 | $3,135 | $136,600 | $33,300 | $103,300 |
| 2014 | $3,135 | $136,600 | $33,300 | $103,300 |
T
Seller's Agent in 2025
The Modern Collective Group
Compass
(401) 744-2692
2 in this area
95 Total Sales

Buyer's Agent in 2025
Lori Saville
Coldwell Banker Realty
(508) 380-9672
1 in this area
84 Total Sales
Source: State-Wide MLS
MLS Number: 1392176
APN: EPRO-000105-000009-000027
Disclaimer: Certain information contained herein is derived from information provided by parties other than Homes.com. All information provided is deemed reliable, but is not guaranteed to be accurate and should be independently verified.
![]() IDX information is provided exclusively for personal, non-commercial use, and may not be used for any purpose other than to identify prospective properties consumers may be interested in purchasing. Information is deemed reliable but not guaranteed.
IDX information is provided exclusively for personal, non-commercial use, and may not be used for any purpose other than to identify prospective properties consumers may be interested in purchasing. Information is deemed reliable but not guaranteed.
Copyright © 2025 State-Wide MLS, Inc. All rights reserved.