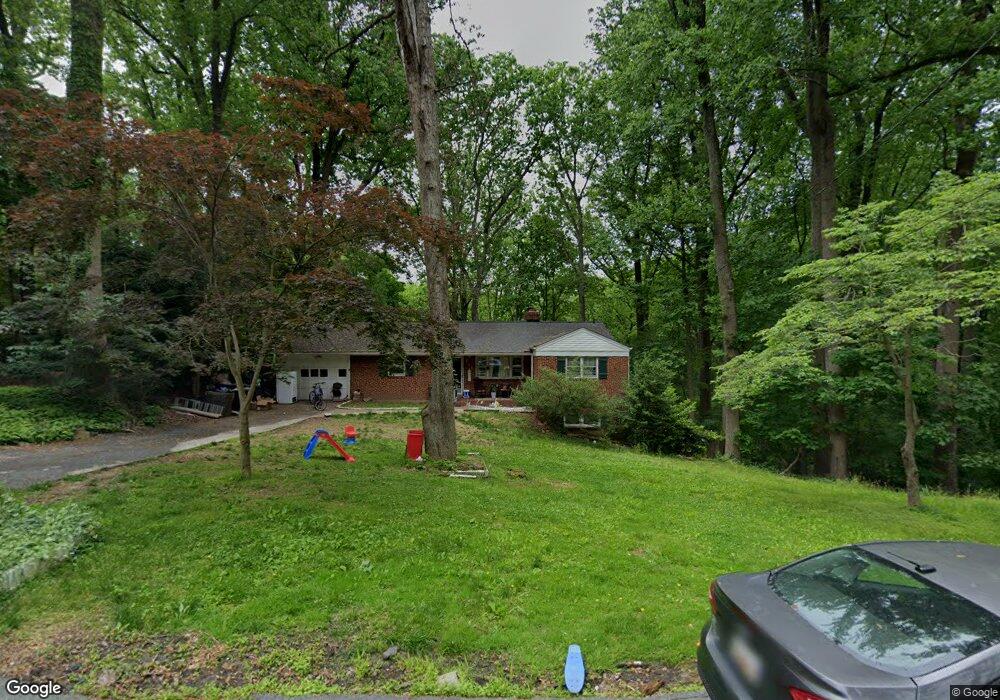
101 Apple Grove Rd Silver Spring, MD 20904
Estimated Value: $616,000 - $702,993
5
Beds
4
Baths
2,633
Sq Ft
$251/Sq Ft
Est. Value
About This Home
This home is located at 101 Apple Grove Rd, Silver Spring, MD 20904 and is currently estimated at $660,248, approximately $250 per square foot. 101 Apple Grove Rd is a home located in Montgomery County with nearby schools including Burnt Mills Elementary School, Francis Scott Key Middle School, and James Hubert Blake High School.
Ownership History
Date
Name
Owned For
Owner Type
Purchase Details
Closed on
Dec 18, 2024
Sold by
Poe Jeffrey W
Bought by
Lelis Aivars J
Current Estimated Value
Home Financials for this Owner
Home Financials are based on the most recent Mortgage that was taken out on this home.
Original Mortgage
$486,000
Outstanding Balance
$482,170
Interest Rate
6.78%
Mortgage Type
New Conventional
Estimated Equity
$178,078
Purchase Details
Closed on
Feb 3, 2010
Sold by
Poe Jeffrey W and Poe Joni K
Bought by
Poe Jeffrey W
Purchase Details
Closed on
May 4, 2005
Sold by
Wallace Family Rev Trust
Bought by
Poe Jeffrey W and Poe Joni K
Purchase Details
Closed on
Apr 21, 2005
Sold by
Wallace Family Rev Trust
Bought by
Poe Jeffrey W and Poe Joni K
Purchase Details
Closed on
Aug 12, 2002
Sold by
Wallace Charles W and Wallace J E
Bought by
Wallace Family Rev Trust
Create a Home Valuation Report for This Property
The Home Valuation Report is an in-depth analysis detailing your home's value as well as a comparison with similar homes in the area
Home Values in the Area
Average Home Value in this Area
Purchase History
| Date | Buyer | Sale Price | Title Company |
|---|---|---|---|
| Lelis Aivars J | $648,000 | Rgs Title | |
| Lelis Aivars J | $648,000 | Rgs Title | |
| Poe Jeffrey W | -- | -- | |
| Poe Jeffrey W | $600,000 | -- | |
| Poe Jeffrey W | $600,000 | -- | |
| Wallace Family Rev Trust | -- | -- |
Source: Public Records
Mortgage History
| Date | Status | Borrower | Loan Amount |
|---|---|---|---|
| Open | Lelis Aivars J | $486,000 | |
| Closed | Lelis Aivars J | $486,000 |
Source: Public Records
Tax History
| Year | Tax Paid | Tax Assessment Tax Assessment Total Assessment is a certain percentage of the fair market value that is determined by local assessors to be the total taxable value of land and additions on the property. | Land | Improvement |
|---|---|---|---|---|
| 2025 | $6,700 | $573,567 | -- | -- |
| 2024 | $6,700 | $529,233 | $0 | $0 |
| 2023 | $6,166 | $484,900 | $276,600 | $208,300 |
| 2022 | $3,846 | $477,167 | $0 | $0 |
| 2021 | $5,531 | $469,433 | $0 | $0 |
| 2020 | $5,531 | $461,700 | $276,600 | $185,100 |
| 2019 | $5,504 | $461,700 | $276,600 | $185,100 |
| 2018 | $5,487 | $461,700 | $276,600 | $185,100 |
| 2017 | $6,144 | $512,500 | $0 | $0 |
| 2016 | $5,072 | $498,100 | $0 | $0 |
| 2015 | $5,072 | $483,700 | $0 | $0 |
| 2014 | $5,072 | $469,300 | $0 | $0 |
Source: Public Records
Map
Nearby Homes
- 314 Crescendo Way
- 644 Symphony Woods Dr
- 420 Lamberton Dr
- 11412 Fairoak Dr
- 11509 Lamberton Ct
- 11715 Stonington Place
- 11348 Baroque Rd
- 11517 Lovejoy St
- 405 Southwest Dr
- 11323 Baritone Ct
- 413 Southwest Dr
- 11006 Childs St
- 11158 Oak Leaf Dr
- 905 Playford Ln
- 229 Hannes St
- 1018 Heartfields Dr
- 907 N Belgrade Rd
- 1116 Tiffany Rd
- 1216 Kathryn Rd
- 10708 Woodsdale Dr
- 109 Apple Grove Rd
- 21 Apple Grove Rd
- 100 Apple Grove Rd
- 108 Apple Grove Rd
- 20 Apple Grove Rd
- 116 Apple Grove Rd
- 11 Apple Grove Rd
- 11612 Michale Ct
- 124 Apple Grove Rd
- 21 Quaint Acres Dr
- 111 Quaint Acres Dr
- 101 Quaint Acres Dr
- 76 Cr 244
- 115 Quaint Acres Dr
- 11606 Michale Ct
- 202 Apple Grove Rd
- 201 Quaint Acres Dr
- 201 Apple Grove Rd
- 207 Quaint Acres Dr
- 10 Quaint Acres Dr
Your Personal Tour Guide
Ask me questions while you tour the home.