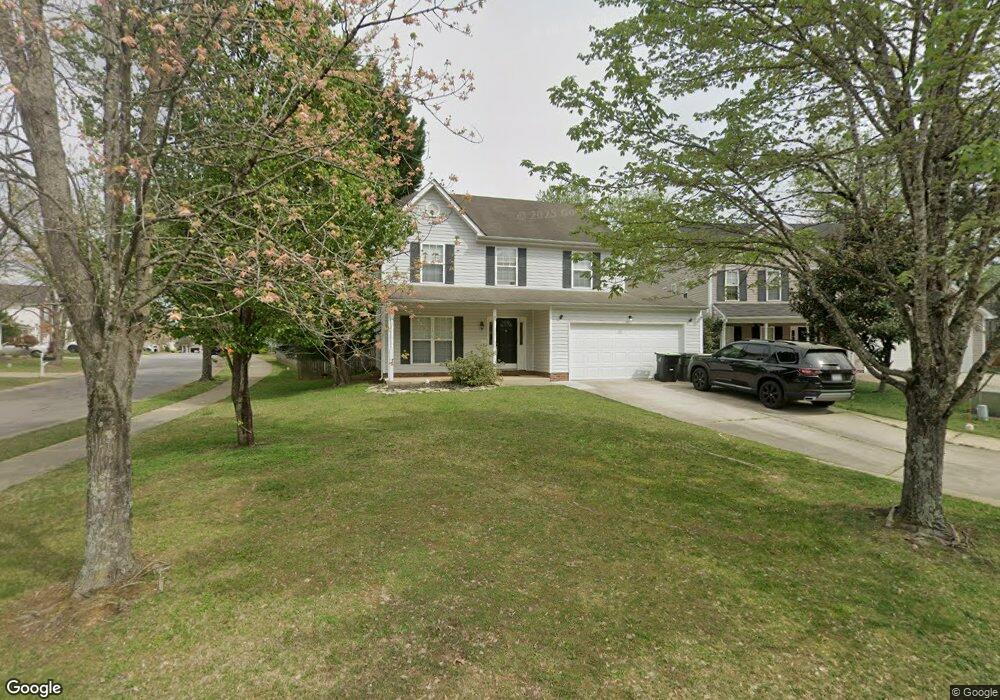
101 Arbor Tree Ct Holly Springs, NC 27540
Estimated Value: $389,385 - $409,000
3
Beds
3
Baths
1,648
Sq Ft
$244/Sq Ft
Est. Value
About This Home
This home is located at 101 Arbor Tree Ct, Holly Springs, NC 27540 and is currently estimated at $402,096, approximately $243 per square foot. 101 Arbor Tree Ct is a home located in Wake County with nearby schools including Holly Springs Elementary School, Holly Ridge Middle School, and Apex Friendship High School.
Ownership History
Date
Name
Owned For
Owner Type
Purchase Details
Closed on
Sep 18, 2008
Sold by
Velasquez Brenda Ann and Velazquez Michael Francis
Bought by
Doyen Alice R
Current Estimated Value
Home Financials for this Owner
Home Financials are based on the most recent Mortgage that was taken out on this home.
Original Mortgage
$55,000
Outstanding Balance
$36,530
Interest Rate
6.49%
Mortgage Type
Purchase Money Mortgage
Estimated Equity
$365,566
Purchase Details
Closed on
Aug 22, 2006
Sold by
Sioss Robert L and Sioss Natasha N
Bought by
Velasquez Michael Francis and Velasquez Brenda Ann
Home Financials for this Owner
Home Financials are based on the most recent Mortgage that was taken out on this home.
Original Mortgage
$32,600
Interest Rate
6.73%
Mortgage Type
Stand Alone Second
Purchase Details
Closed on
Apr 27, 2000
Sold by
K R Builders Inc
Bought by
Sioss Robert L and Sioss Natasha N
Home Financials for this Owner
Home Financials are based on the most recent Mortgage that was taken out on this home.
Original Mortgage
$138,176
Interest Rate
8.24%
Mortgage Type
FHA
Create a Home Valuation Report for This Property
The Home Valuation Report is an in-depth analysis detailing your home's value as well as a comparison with similar homes in the area
Home Values in the Area
Average Home Value in this Area
Purchase History
| Date | Buyer | Sale Price | Title Company |
|---|---|---|---|
| Doyen Alice R | $187,000 | None Available | |
| Velasquez Michael Francis | $163,000 | None Available | |
| Sioss Robert L | $140,000 | -- |
Source: Public Records
Mortgage History
| Date | Status | Borrower | Loan Amount |
|---|---|---|---|
| Open | Doyen Alice R | $55,000 | |
| Previous Owner | Velasquez Michael Francis | $32,600 | |
| Previous Owner | Velasquez Michael Francis | $130,400 | |
| Previous Owner | Sioss Robert L | $138,176 |
Source: Public Records
Tax History Compared to Growth
Tax History
| Year | Tax Paid | Tax Assessment Tax Assessment Total Assessment is a certain percentage of the fair market value that is determined by local assessors to be the total taxable value of land and additions on the property. | Land | Improvement |
|---|---|---|---|---|
| 2025 | $3,202 | $369,687 | $110,000 | $259,687 |
| 2024 | $3,188 | $369,687 | $110,000 | $259,687 |
| 2023 | $2,592 | $238,424 | $55,000 | $183,424 |
| 2022 | $2,502 | $238,424 | $55,000 | $183,424 |
| 2021 | $2,456 | $238,424 | $55,000 | $183,424 |
| 2020 | $2,456 | $238,424 | $55,000 | $183,424 |
| 2019 | $2,372 | $195,438 | $50,000 | $145,438 |
| 2018 | $2,144 | $195,438 | $50,000 | $145,438 |
| 2017 | $2,067 | $195,438 | $50,000 | $145,438 |
| 2016 | $2,039 | $195,438 | $50,000 | $145,438 |
| 2015 | $1,871 | $176,404 | $36,000 | $140,404 |
| 2014 | -- | $173,696 | $36,000 | $137,696 |
Source: Public Records
Map
Nearby Homes
- 138 Cobalt Creek Way
- 213 Capello Ct
- 1539 N Main St
- 204 Leafgate Ct
- 112 Sanchez Ct
- 208 Apple Drupe Way
- 116 Cobblebrook Ct
- 201 Holmby Ct
- 425 Arbor Creek Dr
- 317 Commons Dr
- 148 Danesway Dr
- 329 N Main St
- 112 Fairford Dr
- 300 Firefly Rd
- 225 Hazelmere Dr
- 204 Chrismill Ln
- 5620 Lockley Rd
- 109 Bright Shade Ct
- 725 Little Leaf Ct
- 228 Masden Rd
- 105 Arbor Tree Ct
- 404 Arbor Crest Rd
- 100 Arbor Forest Dr
- 109 Arbor Tree Ct
- 104 Arbor Forest Dr
- 401 Arbor Crest Rd
- 405 Arbor Crest Rd
- 100 Arbor Tree Ct
- 108 Arbor Forest Dr
- 112 Arbor Tree Ct
- 361 Arbor Crest Rd
- 409 Arbor Crest Rd
- 108 Arbor Tree Ct
- 104 Arbor Tree Ct
- 413 Arbor Crest Rd
- 357 Arbor Crest Rd
- 109 Anchor Creek Way
- 105 Anchor Creek Way
- 356 Arbor Crest Rd
- 101 Arbor Forest Dr