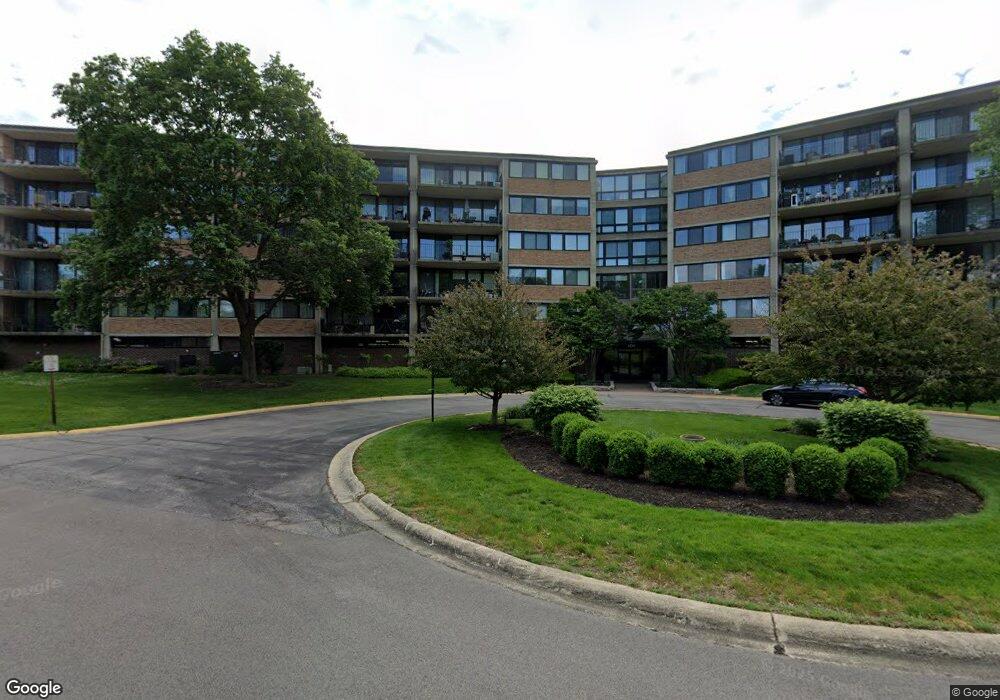
101 Bar Harbour Rd Unit 3 Schaumburg, IL 60193
East Schaumburg NeighborhoodEstimated Value: $260,000 - $281,000
2
Beds
--
Bath
1,200
Sq Ft
$229/Sq Ft
Est. Value
About This Home
This home is located at 101 Bar Harbour Rd Unit 3, Schaumburg, IL 60193 and is currently estimated at $275,077, approximately $229 per square foot. 101 Bar Harbour Rd Unit 3 is a home located in Cook County with nearby schools including Michael Collins Elementary School, Margaret Mead Junior High School, and J B Conant High School.
Ownership History
Date
Name
Owned For
Owner Type
Purchase Details
Closed on
Jun 19, 2020
Sold by
Marston Matthew E and Kwak Megan M
Bought by
Marston Virginia S and Marston Virginia S
Current Estimated Value
Purchase Details
Closed on
Feb 18, 2019
Sold by
Joyce Brian J
Bought by
Marston Matthew E and Kwak Megan M
Home Financials for this Owner
Home Financials are based on the most recent Mortgage that was taken out on this home.
Original Mortgage
$152,000
Outstanding Balance
$134,619
Interest Rate
4.87%
Mortgage Type
New Conventional
Estimated Equity
$140,458
Purchase Details
Closed on
Jul 13, 2007
Sold by
America United Bank & Trust Co Usa
Bought by
Joyce Brian J
Home Financials for this Owner
Home Financials are based on the most recent Mortgage that was taken out on this home.
Original Mortgage
$168,150
Interest Rate
6.71%
Mortgage Type
Purchase Money Mortgage
Create a Home Valuation Report for This Property
The Home Valuation Report is an in-depth analysis detailing your home's value as well as a comparison with similar homes in the area
Home Values in the Area
Average Home Value in this Area
Purchase History
| Date | Buyer | Sale Price | Title Company |
|---|---|---|---|
| Marston Virginia S | -- | Attorney | |
| Marston Matthew E | $160,000 | Citywide Title Corporation | |
| Joyce Brian J | $177,000 | Cti |
Source: Public Records
Mortgage History
| Date | Status | Borrower | Loan Amount |
|---|---|---|---|
| Open | Marston Matthew E | $152,000 | |
| Previous Owner | Joyce Brian J | $168,150 |
Source: Public Records
Tax History Compared to Growth
Tax History
| Year | Tax Paid | Tax Assessment Tax Assessment Total Assessment is a certain percentage of the fair market value that is determined by local assessors to be the total taxable value of land and additions on the property. | Land | Improvement |
|---|---|---|---|---|
| 2024 | $3,267 | $17,633 | $1,039 | $16,594 |
| 2023 | $3,117 | $17,633 | $1,039 | $16,594 |
| 2022 | $3,117 | $17,633 | $1,039 | $16,594 |
| 2021 | $2,041 | $12,728 | $1,331 | $11,397 |
| 2020 | $3,791 | $12,728 | $1,331 | $11,397 |
| 2019 | $3,793 | $14,150 | $1,331 | $12,819 |
| 2018 | $3,176 | $10,583 | $1,120 | $9,463 |
| 2017 | $3,126 | $10,583 | $1,120 | $9,463 |
| 2016 | $2,923 | $10,583 | $1,120 | $9,463 |
| 2015 | $3,123 | $10,439 | $973 | $9,466 |
| 2014 | $3,089 | $10,439 | $973 | $9,466 |
| 2013 | $3,010 | $10,439 | $973 | $9,466 |
Source: Public Records
Map
Nearby Homes
- 101 Bar Harbour Rd Unit 6
- 15 Bar Harbour Rd Unit 4F
- 152 Brookston Dr Unit C2
- 228 Arrowwood Ct Unit D1
- 1300 Woodside Ct Unit B1
- 1264 Williamsburg Dr Unit D2
- 1301 Timberwood Ct Unit D1
- 1251 Williamsburg Dr Unit D-1
- 1221 Plum Tree Ct Unit 5481RD
- 368 Southbury Ct Unit D2
- 321 Woodbury Ct Unit D2
- 373 Southbury Ct Unit D-1
- 367 Greystone Ct Unit A2
- 60 Whitman Dr
- 236 Deerpath Ct Unit 3333LA
- 1386 Scarboro Rd Unit 1102
- 1385 Scarboro Rd Unit 204
- 327 Wildberry Ct Unit D2
- 391 Thornhill Ct Unit B1
- 1525 Sandburg Dr
- 101 Bar Harbour Rd Unit 4D
- 101 Bar Harbour Rd Unit 6E
- 101 Bar Harbour Rd Unit 4Q
- 101 Bar Harbour Rd Unit 3B
- 101 Bar Harbour Rd Unit 4B
- 101 Bar Harbour Rd Unit 3A
- 101 Bar Harbour Rd Unit 2
- 101 Bar Harbour Rd Unit 4
- 101 Bar Harbour Rd Unit 6
- 101 Bar Harbour Rd Unit 5
- 101 Bar Harbour Rd Unit 3
- 101 Bar Harbour Rd Unit 5
- 101 Bar Harbour Rd Unit 5
- 101 Bar Harbour Rd Unit 4
- 101 Bar Harbour Rd Unit 4
- 101 Bar Harbour Rd Unit 5
- 101 Bar Harbour Rd Unit 4
- 101 Bar Harbour Rd Unit 3
- 101 Bar Harbour Rd Unit 2
- 101 Bar Harbour Rd Unit 4