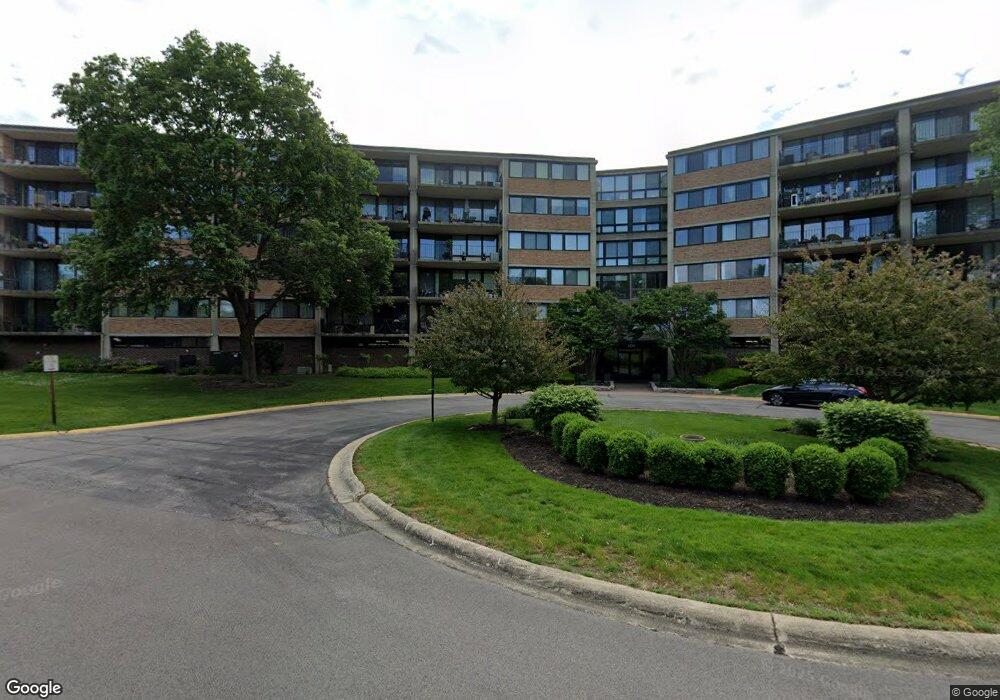
101 Bar Harbour Rd Unit 5 Schaumburg, IL 60193
East Schaumburg NeighborhoodEstimated Value: $268,000 - $280,000
2
Beds
2
Baths
1,200
Sq Ft
$228/Sq Ft
Est. Value
About This Home
This home is located at 101 Bar Harbour Rd Unit 5, Schaumburg, IL 60193 and is currently estimated at $273,809, approximately $228 per square foot. 101 Bar Harbour Rd Unit 5 is a home located in Cook County with nearby schools including Michael Collins Elementary School, Margaret Mead Junior High School, and J B Conant High School.
Ownership History
Date
Name
Owned For
Owner Type
Purchase Details
Closed on
Nov 24, 2008
Sold by
Keric Roger and Keric Denise
Bought by
Holmes Ermine A
Current Estimated Value
Home Financials for this Owner
Home Financials are based on the most recent Mortgage that was taken out on this home.
Original Mortgage
$55,000
Outstanding Balance
$36,974
Interest Rate
6.49%
Mortgage Type
Unknown
Estimated Equity
$236,835
Purchase Details
Closed on
Feb 15, 2008
Sold by
Keric Olivera
Bought by
Keric Roger
Home Financials for this Owner
Home Financials are based on the most recent Mortgage that was taken out on this home.
Original Mortgage
$117,000
Interest Rate
5.75%
Mortgage Type
Unknown
Purchase Details
Closed on
Aug 31, 2005
Sold by
Castonzo Theresa M
Bought by
Keric Olivera
Home Financials for this Owner
Home Financials are based on the most recent Mortgage that was taken out on this home.
Original Mortgage
$60,000
Interest Rate
5.82%
Mortgage Type
Fannie Mae Freddie Mac
Create a Home Valuation Report for This Property
The Home Valuation Report is an in-depth analysis detailing your home's value as well as a comparison with similar homes in the area
Home Values in the Area
Average Home Value in this Area
Purchase History
| Date | Buyer | Sale Price | Title Company |
|---|---|---|---|
| Holmes Ermine A | $180,000 | Attorneys Title Guaranty Fun | |
| Keric Roger | $130,000 | Pntn | |
| Keric Olivera | $166,500 | Agtf Inc |
Source: Public Records
Mortgage History
| Date | Status | Borrower | Loan Amount |
|---|---|---|---|
| Open | Holmes Ermine A | $55,000 | |
| Previous Owner | Keric Roger | $117,000 | |
| Previous Owner | Keric Olivera | $60,000 |
Source: Public Records
Tax History Compared to Growth
Tax History
| Year | Tax Paid | Tax Assessment Tax Assessment Total Assessment is a certain percentage of the fair market value that is determined by local assessors to be the total taxable value of land and additions on the property. | Land | Improvement |
|---|---|---|---|---|
| 2024 | $4,019 | $17,665 | $1,041 | $16,624 |
| 2023 | $3,869 | $17,665 | $1,041 | $16,624 |
| 2022 | $3,869 | $17,665 | $1,041 | $16,624 |
| 2021 | $3,865 | $12,751 | $1,333 | $11,418 |
| 2020 | $3,798 | $12,751 | $1,333 | $11,418 |
| 2019 | $3,799 | $14,175 | $1,333 | $12,842 |
| 2018 | $1,015 | $10,602 | $1,122 | $9,480 |
| 2017 | $981 | $10,602 | $1,122 | $9,480 |
| 2016 | $1,561 | $10,602 | $1,122 | $9,480 |
| 2015 | $1,776 | $10,458 | $975 | $9,483 |
| 2014 | $1,720 | $10,458 | $975 | $9,483 |
| 2013 | $1,174 | $10,458 | $975 | $9,483 |
Source: Public Records
Map
Nearby Homes
- 101 Bar Harbour Rd Unit 6
- 15 Bar Harbour Rd Unit 4F
- 152 Brookston Dr Unit C2
- 228 Arrowwood Ct Unit D1
- 1300 Woodside Ct Unit B1
- 1264 Williamsburg Dr Unit D2
- 1301 Timberwood Ct Unit D1
- 1251 Williamsburg Dr Unit D-1
- 1221 Plum Tree Ct Unit 5481RD
- 368 Southbury Ct Unit D2
- 321 Woodbury Ct Unit D2
- 373 Southbury Ct Unit D-1
- 367 Greystone Ct Unit A2
- 60 Whitman Dr
- 236 Deerpath Ct Unit 3333LA
- 1386 Scarboro Rd Unit 1102
- 1385 Scarboro Rd Unit 204
- 327 Wildberry Ct Unit D2
- 391 Thornhill Ct Unit B1
- 1525 Sandburg Dr
- 101 Bar Harbour Rd Unit 4D
- 101 Bar Harbour Rd Unit 6E
- 101 Bar Harbour Rd Unit 4Q
- 101 Bar Harbour Rd Unit 3B
- 101 Bar Harbour Rd Unit 4B
- 101 Bar Harbour Rd Unit 3A
- 101 Bar Harbour Rd Unit 3
- 101 Bar Harbour Rd Unit 2
- 101 Bar Harbour Rd Unit 4
- 101 Bar Harbour Rd Unit 6
- 101 Bar Harbour Rd Unit 5
- 101 Bar Harbour Rd Unit 3
- 101 Bar Harbour Rd Unit 5
- 101 Bar Harbour Rd Unit 5
- 101 Bar Harbour Rd Unit 4
- 101 Bar Harbour Rd Unit 4
- 101 Bar Harbour Rd Unit 4
- 101 Bar Harbour Rd Unit 3
- 101 Bar Harbour Rd Unit 2
- 101 Bar Harbour Rd Unit 4