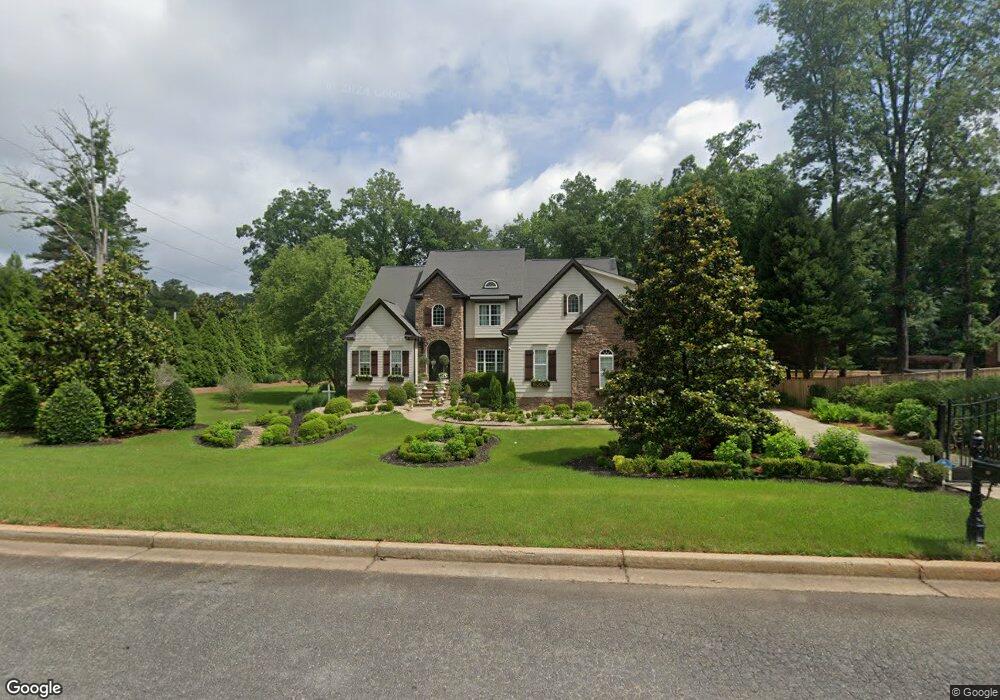
101 Bradford Dr Macon, GA 31210
Estimated Value: $689,000 - $788,423
5
Beds
5
Baths
4,268
Sq Ft
$174/Sq Ft
Est. Value
About This Home
This home is located at 101 Bradford Dr, Macon, GA 31210 and is currently estimated at $742,606, approximately $173 per square foot. 101 Bradford Dr is a home located in Bibb County with nearby schools including Springdale Elementary School, Howard Middle School, and Howard High School.
Ownership History
Date
Name
Owned For
Owner Type
Purchase Details
Closed on
Sep 3, 2009
Sold by
Buckland Willie J
Bought by
Buckland Willie J and Buckland Janeydae
Current Estimated Value
Home Financials for this Owner
Home Financials are based on the most recent Mortgage that was taken out on this home.
Original Mortgage
$417,000
Outstanding Balance
$269,800
Interest Rate
5.14%
Mortgage Type
New Conventional
Estimated Equity
$472,806
Purchase Details
Closed on
Mar 5, 2009
Sold by
M L Casteel Inc
Bought by
Three Oaks Construction & Development In
Home Financials for this Owner
Home Financials are based on the most recent Mortgage that was taken out on this home.
Original Mortgage
$960,000
Interest Rate
5.29%
Mortgage Type
Purchase Money Mortgage
Purchase Details
Closed on
Sep 21, 2004
Bought by
M L Castell Inc
Create a Home Valuation Report for This Property
The Home Valuation Report is an in-depth analysis detailing your home's value as well as a comparison with similar homes in the area
Home Values in the Area
Average Home Value in this Area
Purchase History
| Date | Buyer | Sale Price | Title Company |
|---|---|---|---|
| Buckland Willie J | -- | None Available | |
| Buckland Willie J | $550,000 | None Available | |
| Three Oaks Construction & Development In | $615,000 | None Available | |
| M L Castell Inc | $38,500 | -- |
Source: Public Records
Mortgage History
| Date | Status | Borrower | Loan Amount |
|---|---|---|---|
| Open | Buckland Willie J | $417,000 | |
| Previous Owner | Three Oaks Construction & Development In | $960,000 |
Source: Public Records
Tax History Compared to Growth
Tax History
| Year | Tax Paid | Tax Assessment Tax Assessment Total Assessment is a certain percentage of the fair market value that is determined by local assessors to be the total taxable value of land and additions on the property. | Land | Improvement |
|---|---|---|---|---|
| 2025 | $6,284 | $262,705 | $17,000 | $245,705 |
| 2024 | $6,214 | $251,680 | $17,000 | $234,680 |
| 2023 | $5,757 | $251,680 | $17,000 | $234,680 |
| 2022 | $8,832 | $262,093 | $24,000 | $238,093 |
| 2021 | $8,617 | $233,776 | $24,000 | $209,776 |
| 2020 | $8,804 | $233,776 | $24,000 | $209,776 |
| 2019 | $8,877 | $233,776 | $24,000 | $209,776 |
| 2018 | $13,775 | $233,776 | $24,000 | $209,776 |
| 2017 | $8,122 | $223,783 | $24,000 | $199,783 |
| 2016 | $7,500 | $223,783 | $24,000 | $199,783 |
| 2015 | $10,616 | $223,783 | $24,000 | $199,783 |
| 2014 | $10,633 | $223,783 | $24,000 | $199,783 |
Source: Public Records
Map
Nearby Homes
- 100 S Haven Ct
- 1177 Lucky Debonair Dr
- 1021 Bass Rd
- 4265 Sheraton Dr
- 1231 Woodcrest Dr
- 5761 Kentucky Downs Dr
- 101 Westchester Dr
- 1375 Bass Rd
- 578 Edgefield Way
- 5369 Rivoli Dr
- 6020 Rivoli Dr
- 115 Saddle Run Ct
- 123 Saddle Run Ct
- 136 Rivoli Ridge Dr
- 630 Millrun Ct
- 609 Waverly Ct
- 414 Waverly Ln
- 169 Brookefield Dr
- 105 Bradford Dr
- 104 Bradford Dr
- 109 Bradford Dr
- 108 Bradford Dr
- 1135 Bass Rd
- 115 Bradford Dr
- 145 S Haven Ct
- 1129 Bass Rd
- 112 Bradford Dr
- 1140 Bass Rd
- 147 S Haven Ct
- 143 S Haven Ct
- 1120 Bass Rd
- 119 Bradford Dr Unit 5
- 119 Bradford Dr
- 119 Bradford Dr Unit 300-5
- 1201 Bass Rd
- 139 S Haven Ct
- 116 Bradford Dr
- 146 S Haven Ct